Security Events
Security Events allows you to review mitigated requests and helps you tailor your security configurations. Use Security Events to investigate requests that Cloudflare security products acted on or flagged, identify false positives, and fine-tune your security rules.
If you want to analyze all incoming traffic, including requests that Cloudflare did not act on, refer to Security Analytics instead.
The main elements of the dashboard are the following:
- Events summary: Provides the number of security events on traffic during the selected time period, grouped according to the selected dimension (for example, Action, Host, Country).
- Events by service: Lists the security-related activity per security feature (for example, WAF, API Shield).
- Top events by source: Provides details of the traffic flagged or actioned by a Cloudflare security feature (for example, IP addresses, User Agents, Paths, Countries, Hosts, ASNs).
- Sampled logs: Summarizes security events by date to show the action taken and the applied Cloudflare security product.
Security Events displays information about requests actioned or flagged by Cloudflare security products, including features such as Browser Integrity Check. A single HTTP request can generate one or more security events when it triggers security features. The Security Events dashboard shows these individual events, not the HTTP requests themselves.
Available features vary according to your Cloudflare plan:
| Free | Pro | Business | Enterprise | |
|---|---|---|---|---|
Availability | Yes | Yes | Yes | Yes |
Dashboard features | Sampled logs only | All | All | All |
Account-level dashboard | No | No | No | Yes |
Historical time | Up to the last 24 hours | Up to the last 24 hours | Up to the last 72 hours | Up to the last 30 days |
Export report | No | No | Up to 500 events | Up to 500 events |
Print report | No | Yes | Yes | Yes |
To open Security Events for a given zone:
-
In the Cloudflare dashboard, go to the Analytics page.
Go to Analytics -
Select the Events tab.
- In the Cloudflare dashboard, go to Security > Events.
Additionally, Enterprise customers have access to the account-level dashboard:
Go to Security eventsYou can apply multiple filters and exclusions to narrow the scope of Security Events and adjust the report duration. Modifying the duration, filters, or exclusions affects the analytics data displayed on the entire page including Sampled logs and all graphs.

You can adjust the scope of analytics by manually entering filter conditions. Alternatively, select Filter or Exclude to filter by a field value. These buttons appear when you hover the analytics data legend.
To manually add a filter:
- Select Add filter.
- Select a field, an operator, and a value. For example, to filter events by IP address, select IP for the field, select equals for the operator, and enter the IP address.
- Select Apply.
Take the following into account when entering filter values:
- Do not add quotes around values.
- Do not enter the
ASprefix when entering ASN numbers. For example, enter1423instead ofAS1423. - Wildcards are not supported.
To adjust report duration, select the desired duration from the dropdown. The default value is Previous 24 hours.
The available report duration values depend on your Cloudflare plan. Refer to Availability for details.
To create a custom rule based on your current filters and exclusions:
- Old dashboard: Select Create custom rule.
- New security dashboard: Select Create custom security rule.
The Events summary section provides the number of security events on traffic during the selected time period, grouped according to the selected dimension (for example, Action, Host, Country, or ASN).
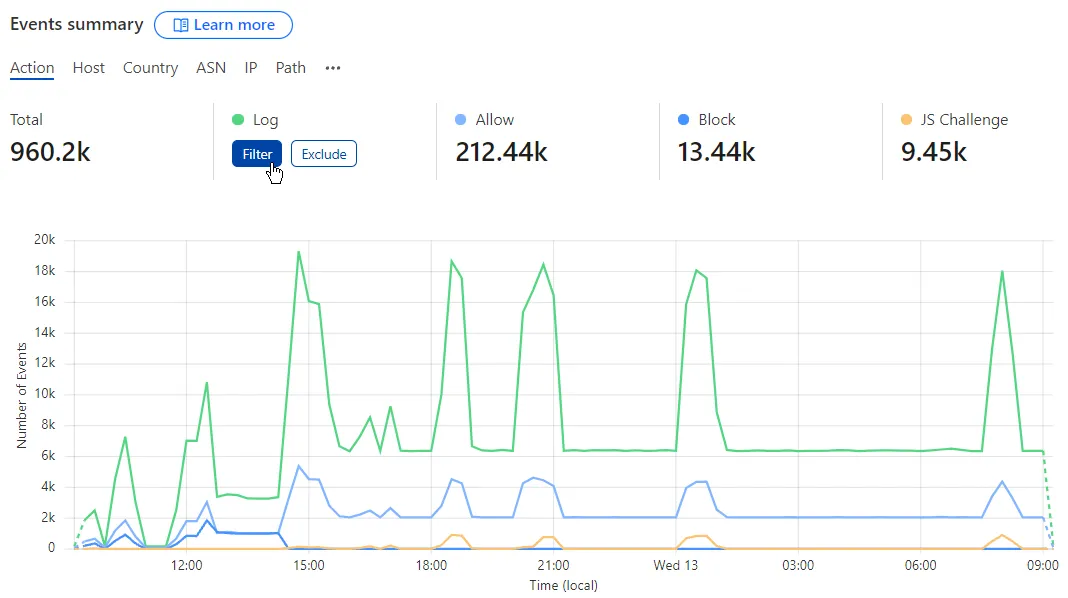
You can adjust the displayed data according to one of the values by selecting Filter or Exclude when hovering the legend.
The