 Dipo Yudhatama
580 California St., Suite 400
San Francisco, CA, 94104
International Journal of Remote Sensing and Earth Sciences (IJReSES)
https://doi.org/10.30536/J.IJRESES.2018.V15.A2795…
10 pages
The Assessment of the physical character of a city is considered relatively easier than the social-cultural aspects. It is important to recognize the type of city form and to predict the behavior of people in the city and its surrounding. Due to those characteristics, the study of the pattern of physical development of the city is required. The objective of research is to analyze the change of spatial pattern of the city due to the city growing by remote sensing. The multitemporal data of Landsat 5/7/8 year 2000, 2006 and 2015 in Jabodetabek area were used. The classification technique had been done and it produced five classes of land uses. Those are water, built-up area, vegetation, other land use and no data. The results of the analysis in Jabodetabek area (Jakarta, Bogor, Depok, Tangerang and Bekasi) show that there was land use changes from vegetation and other land use area to built-up area with an average accuracy of 78% in each year. The pattern of physical development of th...
AI


Urban expansion has increased the exploitation of natural resources and has changed land use and land cover patterns. Land cover change is a major concern of global environment change. The modeling of land cover change is essential to the assessment of consequent environmental impacts. In this work Vijayawada city is taken as case study to observe the extent of urban sprawl in 40 years from 1973 to 2013. Landsat images of Vijayawada city for 1973 MSS, and for 2013 OLI-TIRS which were, rectified and registered in Universal Transverse Mercator (UTM) of zone 44 N, are collected from USGS. The Toposheet and city map are geo-referenced and converted into UTM for sub setting the study area from the Landsat image. After image pre-processing, supervised image classification has been performed to classify the images in different land use categories. Four land use classes have been identified: Urban (Built-up), Light vegetation, Dense vegetation, and Open or Barren land. Change detection analysis shows that there is an increase in built-up area by 308.59% and light vegetation or grass land area 53.97%. Also there is a decrease in dense vegetation area by 24.86% and open land or barren area by 54.57%. Information on urban growth, land use and land cover change study is very useful to local government and urban planners for the betterment of future plans of sustainable development of the city.
Urban expansion has increased the exploitation of natural resources and has changed land use and land cover patterns. Land cover change is a major concern of global environment change. The modeling of land cover change is essential to the assessment of consequent environmental impacts. In this work Vijayawada city is taken as case study to observe the extent of urban sprawl in 40 years from 1973 to 2013. Landsat images of Vijayawada city for 1973 MSS, and for 2013 OLI-TIRS which were, rectified and registered in Universal Transverse Mercator (UTM) of zone 44 N, are collected from USGS. The Toposheet and city map are geo-referenced and converted into UTM for sub setting the study area from the Landsat image. After image pre-processing, supervised image classification has been performed to classify the images in different land use categories. Four land use classes have been identified: Urban (Built-up), Light vegetation, Dense vegetation, and Open or Barren land. Change detection analysis shows that there is an increase in built-up area by 308.59% and light vegetation or grass land area 53.97%. Also there is a decrease in dense vegetation area by 24.86% and open land or barren area by 54.57%. Information on urban growth, land use and land cover change study is very useful to local government and urban planners for the betterment of future plans of sustainable development of the city.
Proceedings of the Proceedings of the 1st International Conference on Environment and Sustainability Issues, ICESI 2019, 18-19 July 2019, Semarang, Central Java, Indonesia, 2019
Semarang City as one the biggest city in Indonesia is still growing as a result of the population continues to grow. This condition results in an increase in the area of land being built. The increase in uncontrolled built-up land can result in changes in surface temperature conditions. The main objective of the study was to determine the development of the index of built-up land in Semarang City from 1997-2017. The object of this study includes land cover, index of built up land in the city of Semarang. This study uses several methods of data collection, namely interview methods, image interpretation, surveys, and secondary data documentation. The tools and materials used were Landsat 5 TM imagery recording on 15 August 1997, Landsat 5 TM imagery recording on 27 August 2007, and Landsat 8 OLI / TIRS Imagery recording on 22 August 2017. For the analysis of built-up land through interpretation of satellite imagery assisted by using the NDBI algorithm NDBI=(SWIR-NIR)/(SWIR+NIR) The results of the study showed that within a period of 20 years the index of land constructed in very high categories experienced a significant change. In 1997 the area of the Very Built Land Index reached 17.74%, then in 2002 it reached 18.42% and in 2017 it reached an area of 21.88%. With the broader NDBI category very high, this can cause a rise in surface temperature which in turn will make Semarang City uncomfortable as a residential city.
Journal of Geographic Information System, 2016
Rangpur is one of the fastest growing cities of Bangladesh with a dense population. Being the headquarter of a division in Bangladesh, it is experiencing multi-dimensional problems such as over urbanization, traffic congestion, water logging, and solid waste disposal. Rangpur is a sheer example of having poor legislative actions, inefficient management and lack of public awareness, which leads the urbanization to an unplanned and resource consuming development. This study presents an integrated study of land use pattern in Rangpur City, Bangladesh, by using Geographical Information Systems (GIS) and Remote Sensing (RS). The data sources used in this study were Landsat Thematic Mapper (TM) and a Landsat Enhanced Thematic Mapper Plus (ETM+) images taken in 1989, 2000 and 2014, respectively. All images were geometrically and radiometrically corrected and the change detection methods were performed. Then, supervised maximum likelihood classification was used as a cross classification to...
Land use and land cover change has become a central component in current strategies for managing natural resources and monitoring environmental changes. Urban expansion has brought serious losses of agriculture land, vegetation land and water bodies. Urban sprawl is responsible for a variety of urban environmental issues like decreased air quality, increased runoff and subsequent flooding, increased local temperature, deterioration of water quality, etc. In this work we have taken Vijayawada city as case to study the urban expansion and land cover change that took place in a span of 36 years from 1973 to 2009. Remote sensing methodology is adopted to study the geographical land use changes occurred during the study period. Landsat images of TM and ETM+ of Vijayawada city area are collected from the USGS Earth Explorer web site. After image pre-processing, un-supervised and supervised image classification has been performed to classify the images in to different land use categories. Five land use classes have been identified as Urban (Built-up), Water body, Agricultural land, Barren land and Vegetation. Classification accuracy is also estimated using the field knowledge obtained from field surveys. The obtained accuracy is between 73 to80 percent for all the classes. Change detection analysis shows that Built-up area has been increased by 372.28%, agricultural area has been decreased by 65.16% and barren area reduced by 60.98%. Information on urban growth, land use and land cover change study is very useful to local government and urban planners for the betterment of future plans of sustainable development of the city.
Journal of Geomatics, 2019
The growth of cities, occurring in uneven and unplanned patterns, affects land use and land cover and it changes the spatial distribution of urban residents. This study seeks to critically understand the pattern of urban growth in Ibadan metropolis, Nigeria by applying heuristic techniques. This study utilized Landsat 5 TM, 7 ETM+ and 8 OLI-TIRS satellite imageries of 1986, 2000 and 2013 respectively of Ibadan. These were integrated into a GIS environment using post-classification change detection approach and employing selected Landscape Metrics (TA, NP, MPS, TE, ED, AWMPFD) to analyze the pattern of urban growth in the area. The built up area in Ibadan has grown from 13302ha in 1986 to 45868ha in 2013 at an average growth rate of 2 and 12% per annum during 1986-2000 and 2000-2013 study periods respectively. Landscape metrics analysis reveal fragmented process of development along the fringes of Ibadan throughout the study periods with substantial increase of urban patches occurring during the second period of urbanization (2000-2013). The core of the city underwent compact growth by infilling of open spaces and through edge expansion over time. Remote sensing and landscape metrics proved valuable for the description of processes in the study.
This study put forward a technique to estimate and monitor the urban built-up land features from Landsat Thematic Mapper (TM) and Enhanced Thematic Mapper Plus (ETM+) imagery taking into account of two blocks in Bankura District, West Bengal as examples. In this study three indices have been selected, viz., Normalized Difference Built-up Index (NDBI), Normalized Difference Water Index (NDWI), and Normalized Differences Vegetation Index (NDVI) to represent three major urban land-use classes, built-up land, open water body and vegetation respectively. Consequently, the seven bands of an original Landsat image were reduced into three thematic-oriented bands derived from above indices. The three new bands were then combined to compose a new image. This considerably reduced data correlation and redundancy between original multispectral bands, and thus significantly avoided the spectral confusion of the above three land-use classes. As a result, the spectral signatures of the three urban land-use classes are more distinguishable in the new composite image than in the original seven-band image as the spectral clusters of the classes are well separated. Through logic calculation on the new image, the urban built-up lands were finally extracted with overall accuracy ranging from 91.5 to 98.5 percent. Therefore, the technique is effective and reliable. In addition, the advantages of over NDVI and over NDWI in the urban study are also discussed in this paper.
AI
The research utilized Enhanced Built-Up and Bareness Index (EBBI), Soil Adjusted Vegetation Index (SAVI), and Modified Normalized Difference Water Index (MNDWI) for land use analysis.
The study observed built-up areas expanding approximately 47 km², predominantly influenced by linear growth along main roads.
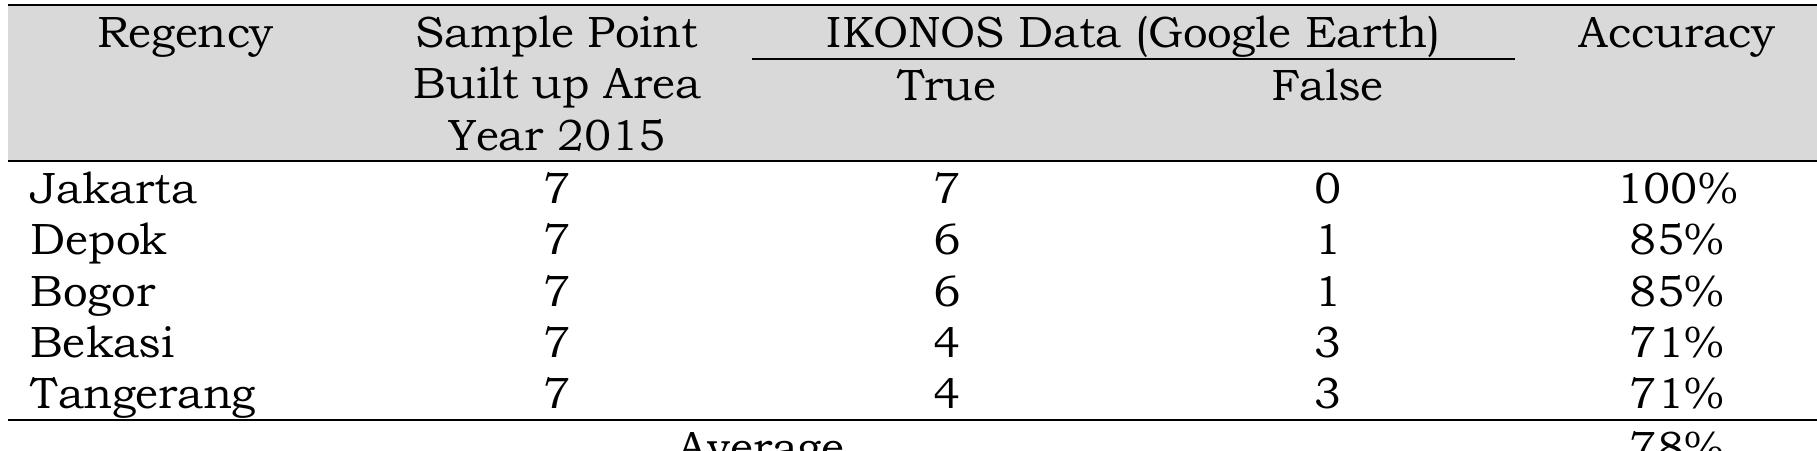
An accuracy analysis was conducted using 35 sampling points compared against Ikonos imagery, achieving an average accuracy of 78%.
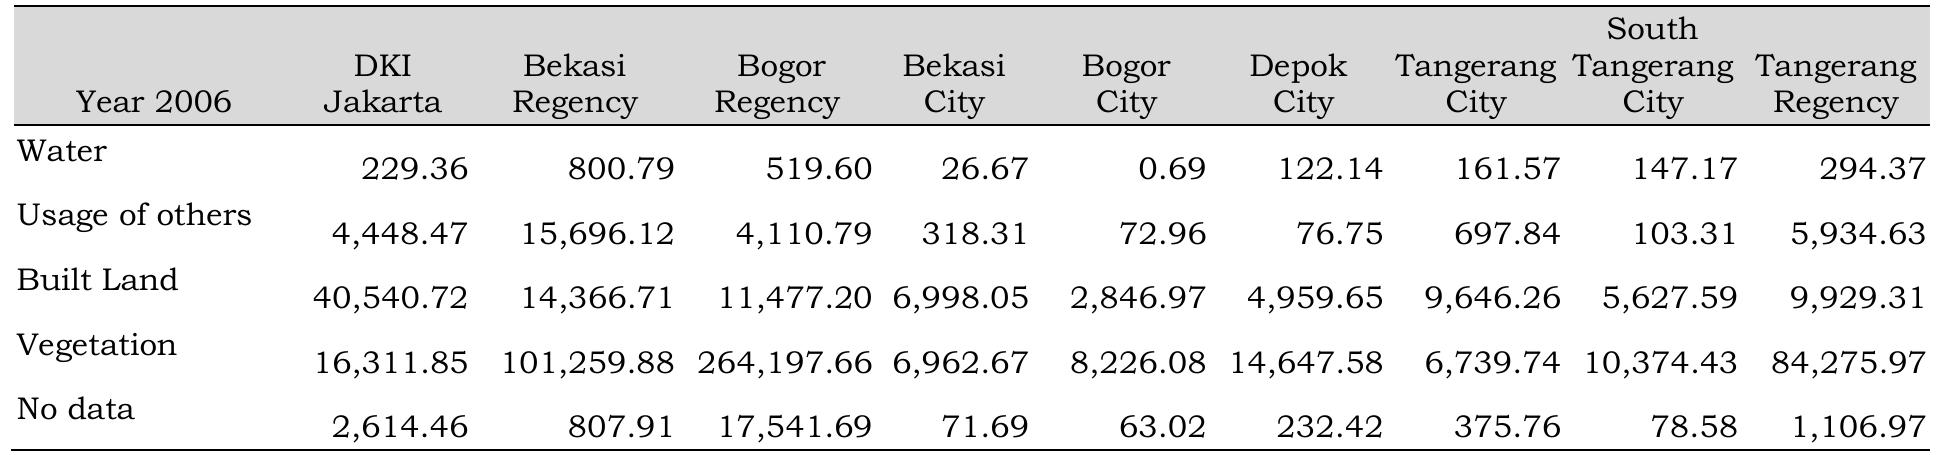
Land cover changes were analyzed for the years 2000, 2006, and 2015, highlighting ongoing urban expansion.
The identified patterns include concentric, ribbon/linear/axial, and leap frog/chequerboard developments.
Coğrafi Bilimler Dergisi, 2025
In this study, urban development and land use changes in this process due to population growth in Atakum district located on the Black Sea coast of Türkiye were examined in 23 years (2000-2023). It was aimed to create a population and land use projection by examining the development of the district in the last 23 years. In order to determine the changes in land use, Landsat 7 ETM images of 2000 and Landsat 8 OLI/TIRS images of 2013 and 2023 were used in the study. The results obtained from Landsat images were compared with the land use data obtained using Sentinel-2 satellite images between 2017-2023. Geographic Information Systems were used to map urban development, land use and population projection results. According to land use projections, it is predicted that forest areas in the district will decrease, residential areas will increase by approximately 3% and the population will approximately double by 2033. For sustainable urban development and land use, plateau areas with low agricultural productivity should be preferred as settlement areas, forest lands should be protected and fertile lands should be used in agricultural production.
International Journal of Innovative Technology and Exploring Engineering, 2020
Abstract: The development of urban areas in the city of Balikpapan increases over time and is characterized by increasing population. The growth and development of urban areas needs to be monitored so that the control function on area spatial can be implemented. This research aims to determine the direction of urban areas and measure the density of the built-up as a leading indicator of the development of urban areas in Balikpapan. The method used in this study is the multispasio-temporal analysis of remote sensing data of Landsat 7 ETM + and Landsat 8 OLI/TIRS which contain a combination of spectral transformation, classification supervised Maximum Likelihood, accuracy assessment and statistical analysis. The results showed the trend of urban development from 2001 to 2019 towards east and northeast with the highest built-up density located in the sub-district of Balikpapan Tengah by 82.07% and followed by the sub-district of Balikpapan Kota by 76.94%. The largest land conversion took place on the bare soil with low vegetation density class to be vegetation with the converted area of 7095.91 ha or approximately 14.10% followed by the bare soil with low vegetation density class to be built-up with the converted area of 5826.86 ha or about 11.58% of the total area of Balikpapan city during the period from 2001 to 2019. The accuracy of urban development map in 2001 reaches 92.39 % and the year 2019 reaches 95.69 %, while the accuracy of land cover map in 2001 reaches 85.57% and the year 2019 reaches 87.28 %.
E3S Web of Conferences, 2020
The population of Jakarta Special Province continues to grow, most significantly after the 1960s, causing an increase of population density. The expanding population has been stimulating the development of the province, reflecting the rising demand of the population including land. Eventually, it influences the urbanization process and affects the dynamic of land utilization in Jakarta. This research is aimed to understand the correlation between urbanization phenomena and landuse change in Jakarta Special Province. The research implements the utilization of statistics, topographic map, and remote sensing data as well. The satellite image (Sentinel-2 Imagery) was used to determine urban area and non urban area which then describes the land urbanization level. During 3 years, Jakarta has experienced landuse change especially in residential area, green open space, and industrial area. In 2017, the urban area covered 76.89 percent of Jakarta’s land and the coverage increased into 78.35...
IRJET, 2021
Urbanization, a very striking phenomenon in this present world of development which inspires the dwellers to consume the resources regardless of brooding about the natural activities. Exploring the urban growth is another appellation of land use change detection which is essential to make any decision about the distribution of the limited properties as urban dynamics influence the environmental management. Change enquiry of landscapes is imperative for better thinking of the connections between human deeds and natural happenings. Sylhet city in Bangladesh is one of the speedy urbanized cities due to the public positive approach towards the city residence. This study is an effort to monitor the urban growth in Sylhet city from 2002 to 2017 by means of Remote Sensing (RS) and Geographic Information System (GIS). Landsat 7 ETM images for the year 2002, 2007, 2012 and 2017 were utilized to assess the urban area growth here. After applying various pre-processing techniques, image classification was performed using supervised classificationmaximum likelihood algorithm. The results indicate that built up area of Sylhet increased from 11.95 km 2 to 18.51 km 2 from 2002 to 2017 losing 43.86% of its green cover startlingly. Correlation of population and built up area reveals a strong association.
Environmental …, 2009
Today, as a result of erratic and unplanned urbanization, towns are rapidly becoming a mass of concrete and town-dwellers are suffocated by their busy and stressful professional lives. They feel a need for places where they can find breathing-space in their free time. Green areas within towns are important spaces where townspeople are able to carry out recreational activities. These places form a link between townspeople and nature. The importance of urban green areas is increasing with every passing day due to their social, psychological, ecological, physical and economic functions and their impact on the quality of towns. In this study it has been attempted to demonstrate the pressures of urban development on agricultural land by determining the changing land use situation over the years in the district of Akhisar. In this research, an aerial photograph from year 1939 and satellite images of the town from the years 2000 and 2007 were used. Land use changes in the region were determined spatially. As a result of this study, which aims to determine in which direction urbanization is progressing in the district, the importance of town planning emerges. This study will be informative for the local authorities in their future town planning projects. With its flat and almost flat fertile arable land, the district of Akhisar occupies an important position within the province of Manisa. From the point of view of olive production the region is one of Turkey's important centres. Fifty-five percent of the olive production in the province of Manisa is realized in Akhisar. However, the results of the present study show that while agricultural areas comprised 2.5805 km 2 in 1939, these had diminished to 1.5146 km 2 in the year 2000 and had diminished to 1.0762 km 2 in the year 2007 and residential area (dense) 0.449 km 2 occupied in 1939, in the year 2000 this had risen to 1.9472 and 2.3238 km 2 in the year 2007. This planless urbanization in the study area has led to great losses of farmland. Keywords Town planning . Urban green areas . Urban and agricultural areas
Jurnal Wilayah dan Lingkungan
Perkembangan aktivitas ekonomi yang terjadi di pusat kota apabila sudah jenuh akan mengalami pergerakan menuju ke arah pinggiran kota. Kota Singaraja adalah salah satu wilayah yang mengalami perkembangan menuju ke arah pinggiran kota. Penelitian ini bertujuan untuk menganalisis perkembangan pinggiran Kota Singaraja secara spasial dengan melihat pola perkembangan kotanya akibat pengaruh urban sprawl dan faktor yang menyebabkannya. Pendekatan analisis spasial digunakan dalam penelitian ini untuk menentukan pola perkembangan kota dan menggunakan pendekatan analisis socio-spatial untuk mengidentifikasi faktor penyebab terjadinya urban sprawl di pinggiran Kota Singaraja.