 Alan Gerber
580 California St., Suite 400
San Francisco, CA, 94104
2003, Oxford handbook of political psychology
…
52 pages
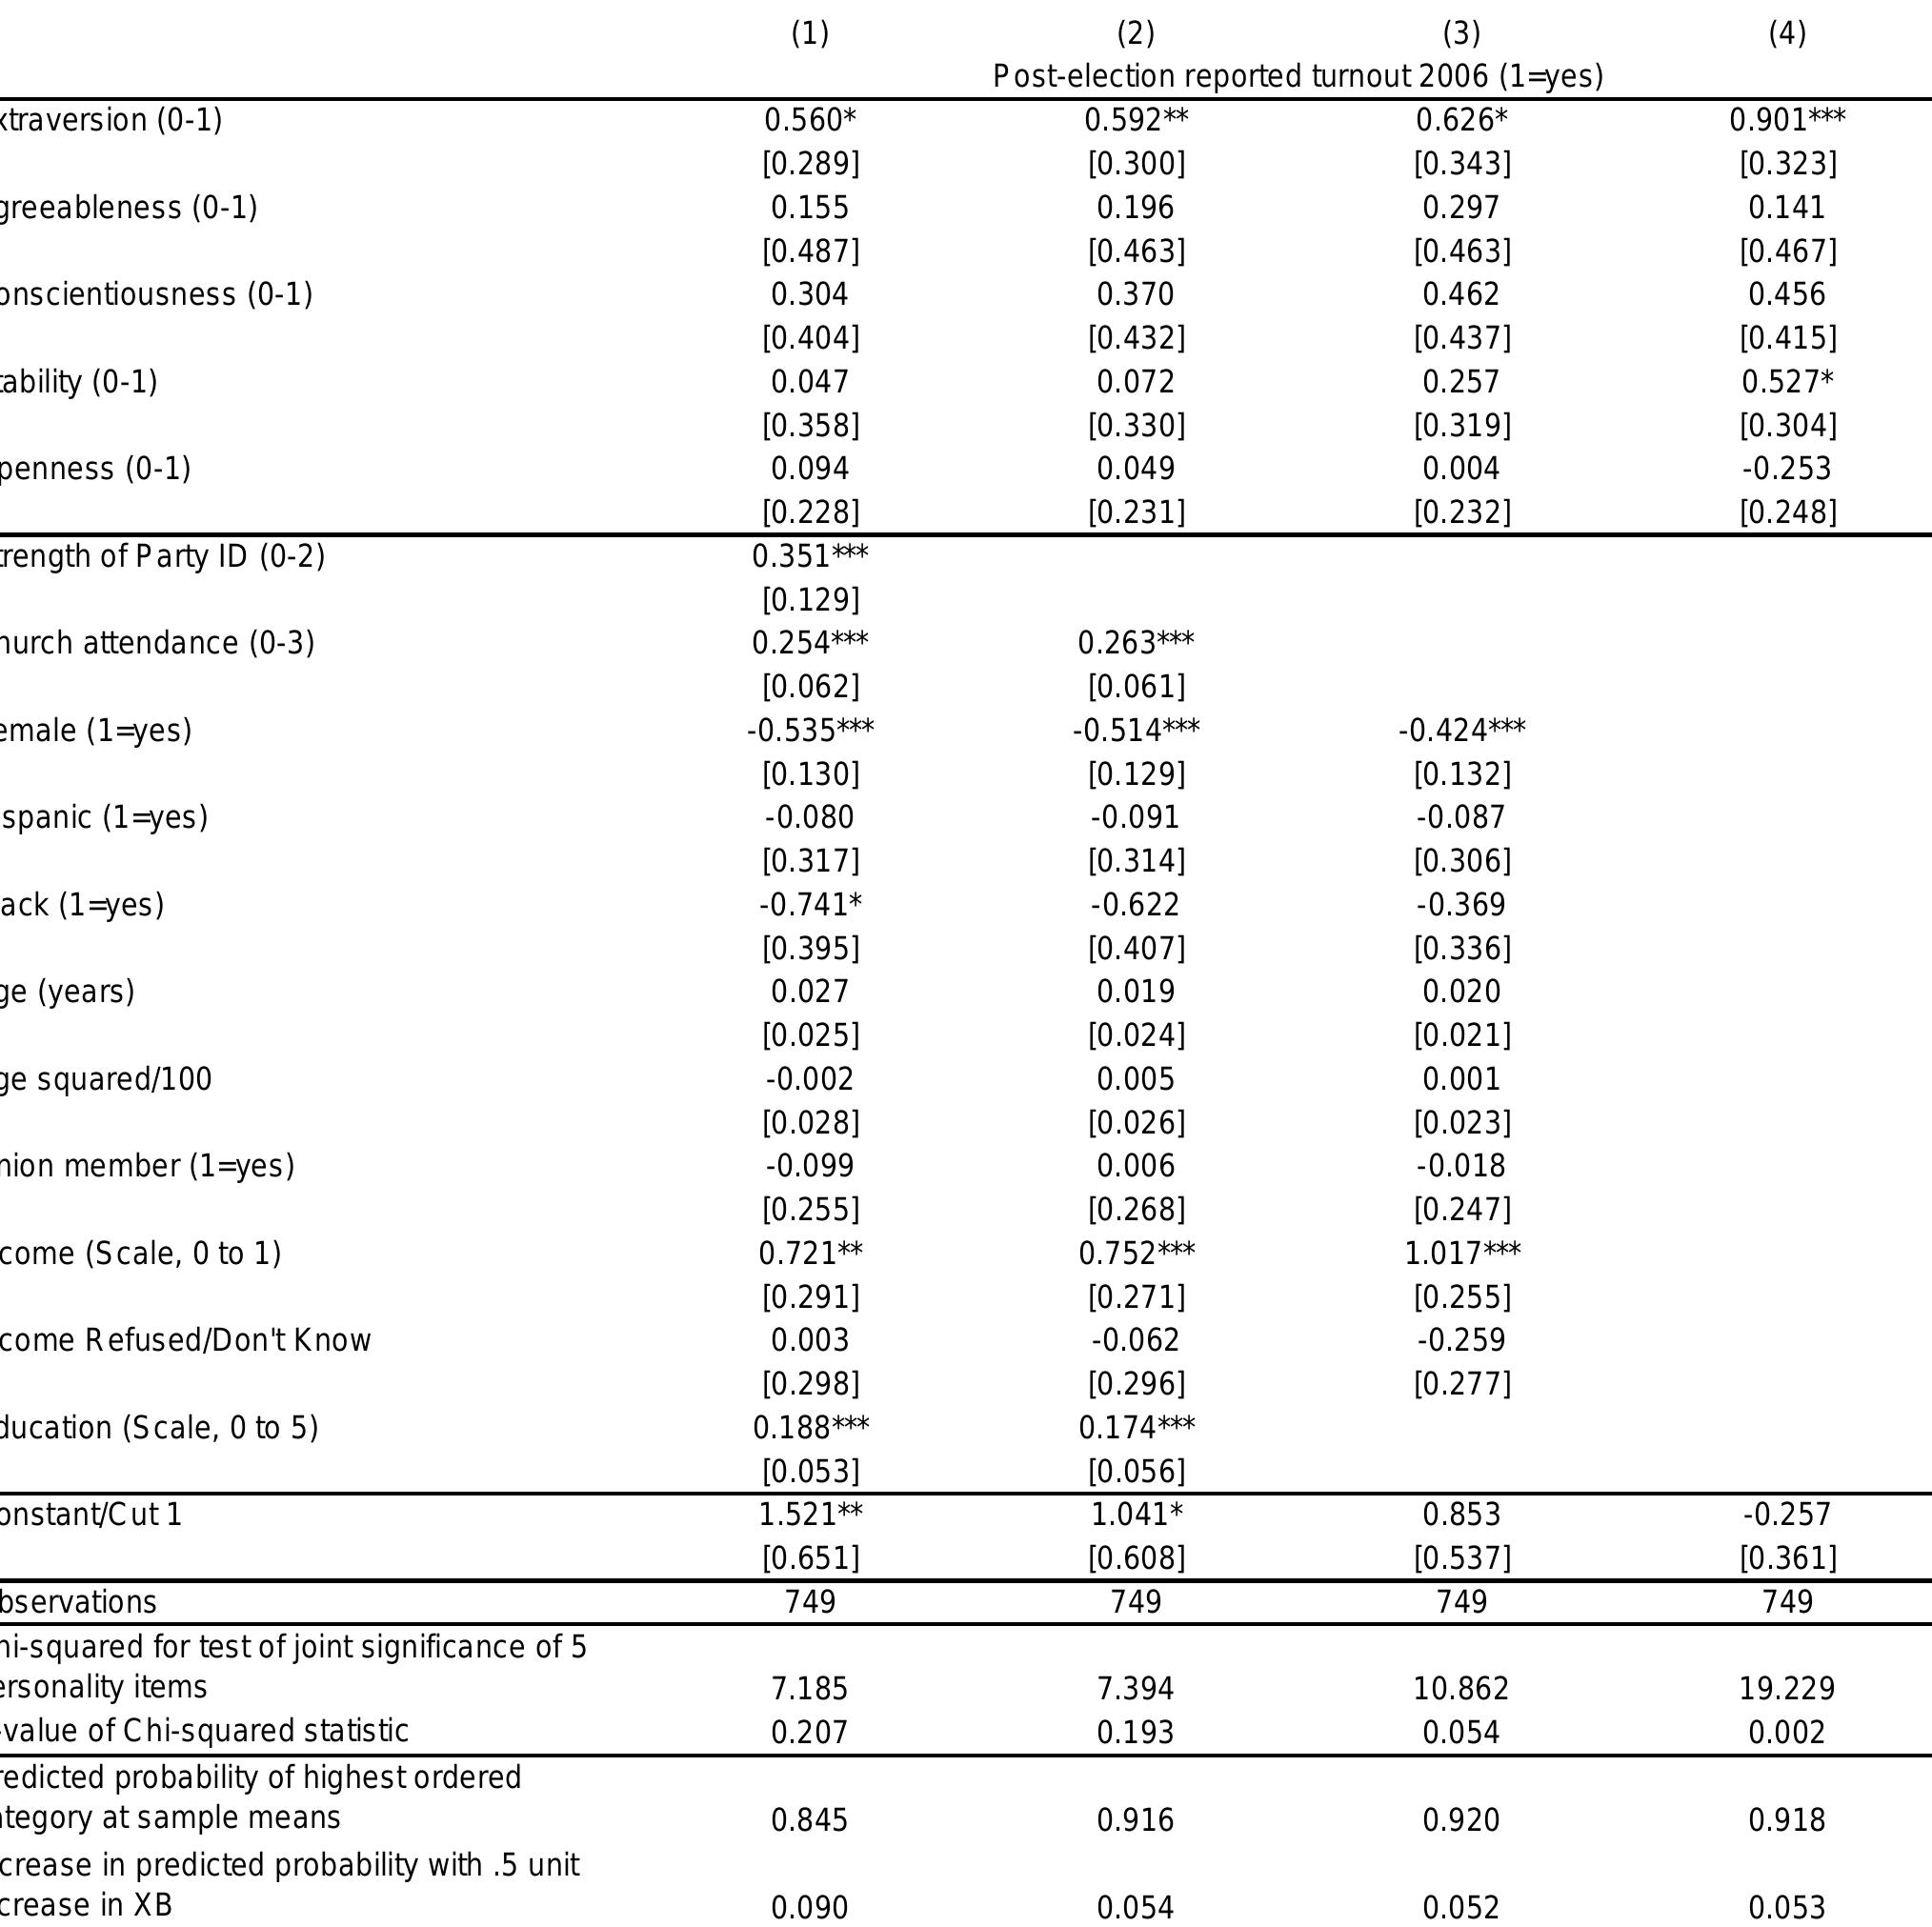
Using data from two recent surveys, we analyze the relationship between personality traits, as measured by the Five-factor Model, and political participation, political ideology, partisanship, and vote choice. We confirm previous findings, including the strong positive association between the personality trait of Openness and liberalism and between Conscientiousness and conservatism, and also report several new results. We merged administrative records containing actual turnout and party registration status with our survey data. Using this novel approach, we confirm that the strong relationship between personality and politics holds when actual behavior is substituted for survey reports. We also measure the association of personality and several forms of political participation, including voting, contributing, and volunteering. The effect of personality on participation is often comparable to, or larger in magnitude than, the effect of factors that are central in earlier models of turnout, such as religious attendance, age, education, and income. 1 recent decades political science has only rarely taken note of, or contributed research on, the role of personality in political behavior.
AI


American Political Science Review, 2010
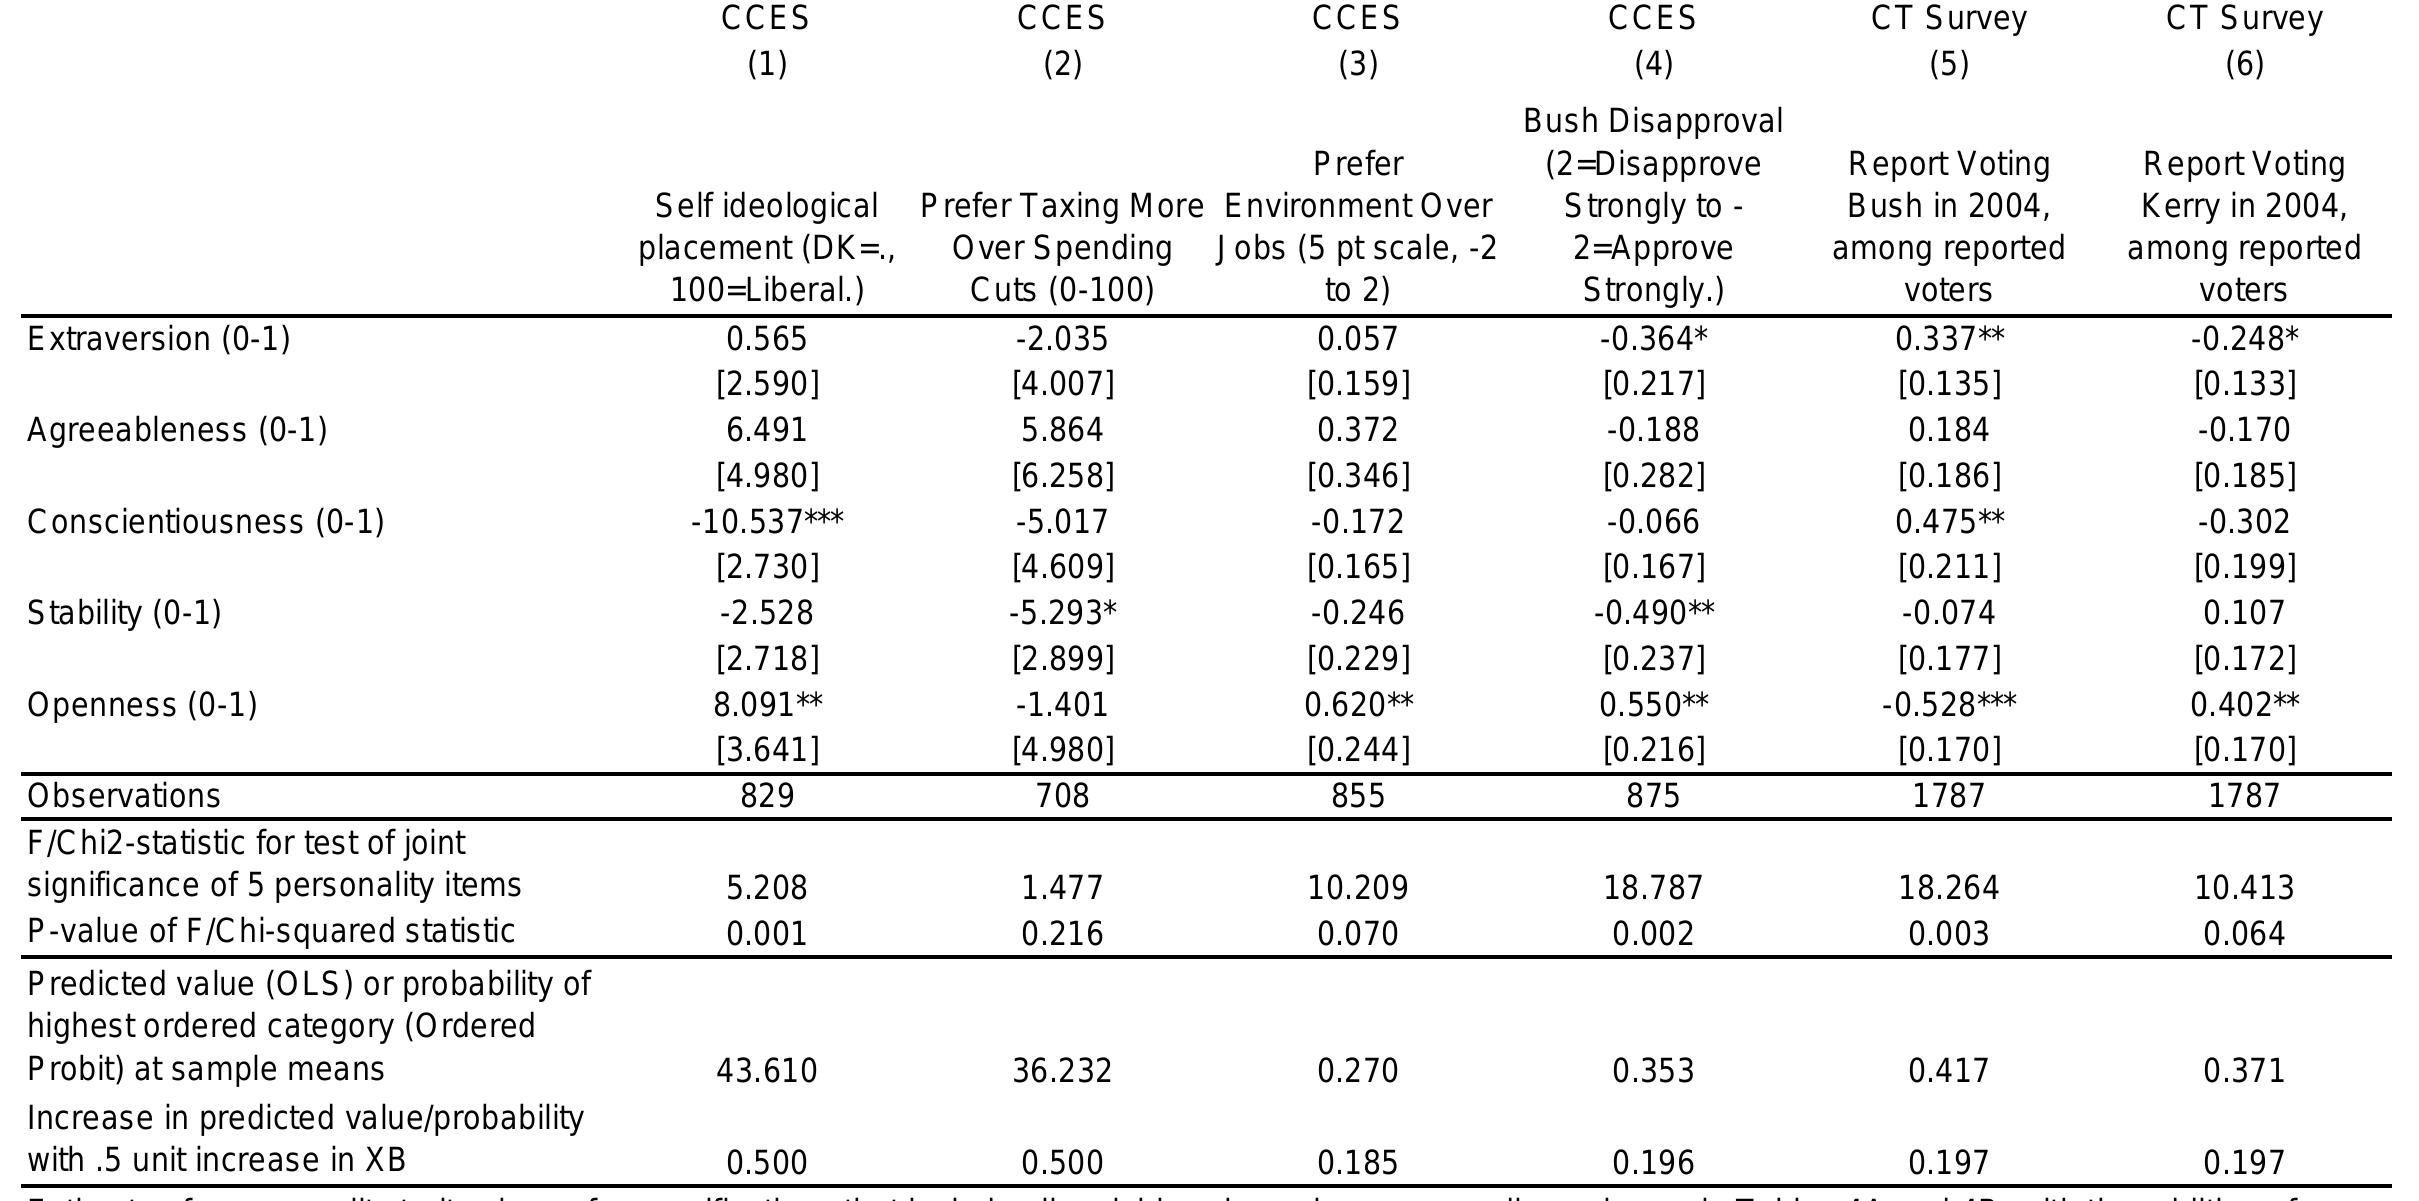
P revious research on personality traits and political attitudes has largely focused on the direct relationships between traits and ideological self-placement. There are theoretical reasons, however, to suspect that the relationships between personality traits and political attitudes (1) vary across issue domains and (2) depend on contextual factors that affect the meaning of political stimuli. In this study, we provide an explicit theoretical framework for formulating hypotheses about these differential effects. We then leverage the power of an unusually large national survey of registered voters to examine how the relationships between Big Five personality traits and political attitudes differ across issue domains and social contexts (as defined by racial groups). We confirm some important previous findings regarding personality and political ideology, find clear evidence that Big Five traits affect economic and social attitudes differently, show that the effect of Big Five traits is often as large as that of education or income in predicting ideology, and demonstrate that the relationships between Big Five traits and ideology vary substantially between white and black respondents.
Political …, 2006
European Journal of Personality, 2020
A burgeoning line of research examining the relation between personality traits and political variables relies extensively on convenience samples. However, our understanding of the extent to which using convenience samples challenges the generalizability of these findings to target populations remains limited. We address this question by testing whether associations between personality and political characteristics observed in representative samples diverged from those observed in the sub-populations most commonly studied in convenience samples, namely students and internet users. We leverage ten high-quality representative datasets to compare the representative samples with the two sub-samples. We did not find any systematic differences in the relationship between personality traits and a broad range of political variables. Instead, results from the sub-samples generalized well to those observed in the broader and more diverse representative sample.
American Politics Research, 2015
Recent studies in political psychology report a significant association between personality traits and ordinary citizens’ attitudes and behaviors in the political arena. A growing body of literature examines the influence of personality on individuals’ attachment to a political party and vote choice in electoral settings. In line with these studies, we analyze the relationship between personality traits and “correct voting”, i.e., the extent to which citizens vote in accordance with their own preferences and values. Using a large-scale national survey fielded in the context of the 2008 presidential election, we find that, after controlling for well-known predictors of correct voting, some of personality traits not only exert a direct influence on correct voting, but also moderate the effect of strength of party identification, a well-established determinant of correct voting. These findings provide new evidence for the idea that individual differences such as dispositional personali...
Political Psychology, 2013
Using a nationally representative survey fielded in 2009, we analyze the relationships between personality traits and various modes of political participation in South Korea. We find statistically significant relationships between personality (measured by the Five-Factor Model) and several nonelectoral modes of participation. Openness correlates positively with protest participation, rally attendance, financial contributions to political causes, news media contacts, and political activities via the Internet. Agreeableness correlates negatively with these five participation modes as well as petition signing. Conscientiousness is positively associated with individual political acts (e.g., contacting news media and elected officials and donation), while it is negatively associated with collective actions such as participation in rally. However, we do not find any significant relationship between personality and voter turnout. Reflecting an unusually conflictual political climate of South Korea in 2008, we discuss these findings' implications focusing on the personality-situation interactions.
Scandinavian Political Studies, 2011
Scholars in the field of electoral participation have for long been aware that turnout is strongly connected to sociopsychological variables such as religiosity, party identification, political interest and sense of political efficacy. The impact of personality characteristics has remained largely unexplored until recently. Based on the Jyväskylä Longitudinal Study of Personality and Social Development (JYLS, original N = 369), this article analyses the links between individuals' personality traits and their propensity to vote at ages 36, 42 and 50. The personality traits are measured by using the five-factor model of personality consisting of extraversion, agreeableness, conscientiousness, neuroticism and openness to experience. The results show both extraversion and agreeableness to be positively associated with electoral participation, but the findings are not consistent at all ages. Finally, the analysis suggests that the effect of extraversion varies depending on the level of education. Whereas well-educated people are more prone to be habitual voters regardless of their level of extraversion, among less-educated respondents it has a more sizeable effect.
politicalcommunication.org
The term personality refers to the fact that people have different, relatively stable characteristics that influence their perceptions and behaviors. One of the most widely accepted models is the big five factor model, which advocates that individual personality differences can be ...
2010
This paper investigates the impact of the HEXACO model of personality structure in predicting political ideology and voting. Five-hundred and seventeen participants provided responses for measures of the HEXACO and the Five Factor Models, ideological orientation, and past voting. Results showed that Conscientiousness was linked to voting for right-wing parties, whereas Honesty-Humility, Agreeableness and Openness were related to voting for left-wing parties. Ideological orientation mediated the relationship between personality traits and voting. Hierarchical tests indicated that the HEXACO outperformed the Five Factor Model in predicting ideological orientation.
Electoral Studies, 2014
This study examines whether the Big Five personality traits have different effects on male and female turnout. Previous research has reported an association between personality traits and turnout, but their results have been inconsistent. Nevertheless, there is a solid evidence of gender differences in personality traits and past studies have not taken into consideration the option that personality-turnout relationship might be genderdifferentiated. The current study empirically finds that conscientiousness and emotional stability can significantly increase female turnout, but have no effect on male turnout. Furthermore, openness to experience exerts opposite effects on male and female turnout. As openness to experience increases, men become more likely to vote, whereas women become less likely to cast their ballots. However, extraversion and agreeableness are not associated with turnout, regardless of gender. To sum up, this study provides robust evidence that the effects of personality traits on turnout vary by gender and suggests that any future study of the topic must include interaction between gender and personality in order to estimate the effect of personality on turnout in a more accurate manner.
Personality Traits and Political Attitude , 2019
The focus of this study was to find the connection between the Big Five Personality Traits and the Political Attitude using the “Big Five” traits (Extraversion, Conscientiousness, Neuroticism, Agreeableness, and Openness to Experience). Participants were from the University of Pecs (N = 67) which took part in this study. Results suggest that there was a tendency negative connection of Extraversion and positive connection of Conscientiousness on voting behavior. However, Neuroticism was found a tendency negative, and Conscientiousness was positive correlated with political behavior. Also, Agreeableness and Conscientiousness correlated positively on liberalism. Surprisingly, there was a positive correlation between Agreeableness and Openness to Experience on Conspiracy theory.
AI
The research finds Extraversion positively correlates with political participation, increasing voter turnout by 2.5-6.5 percentage points.
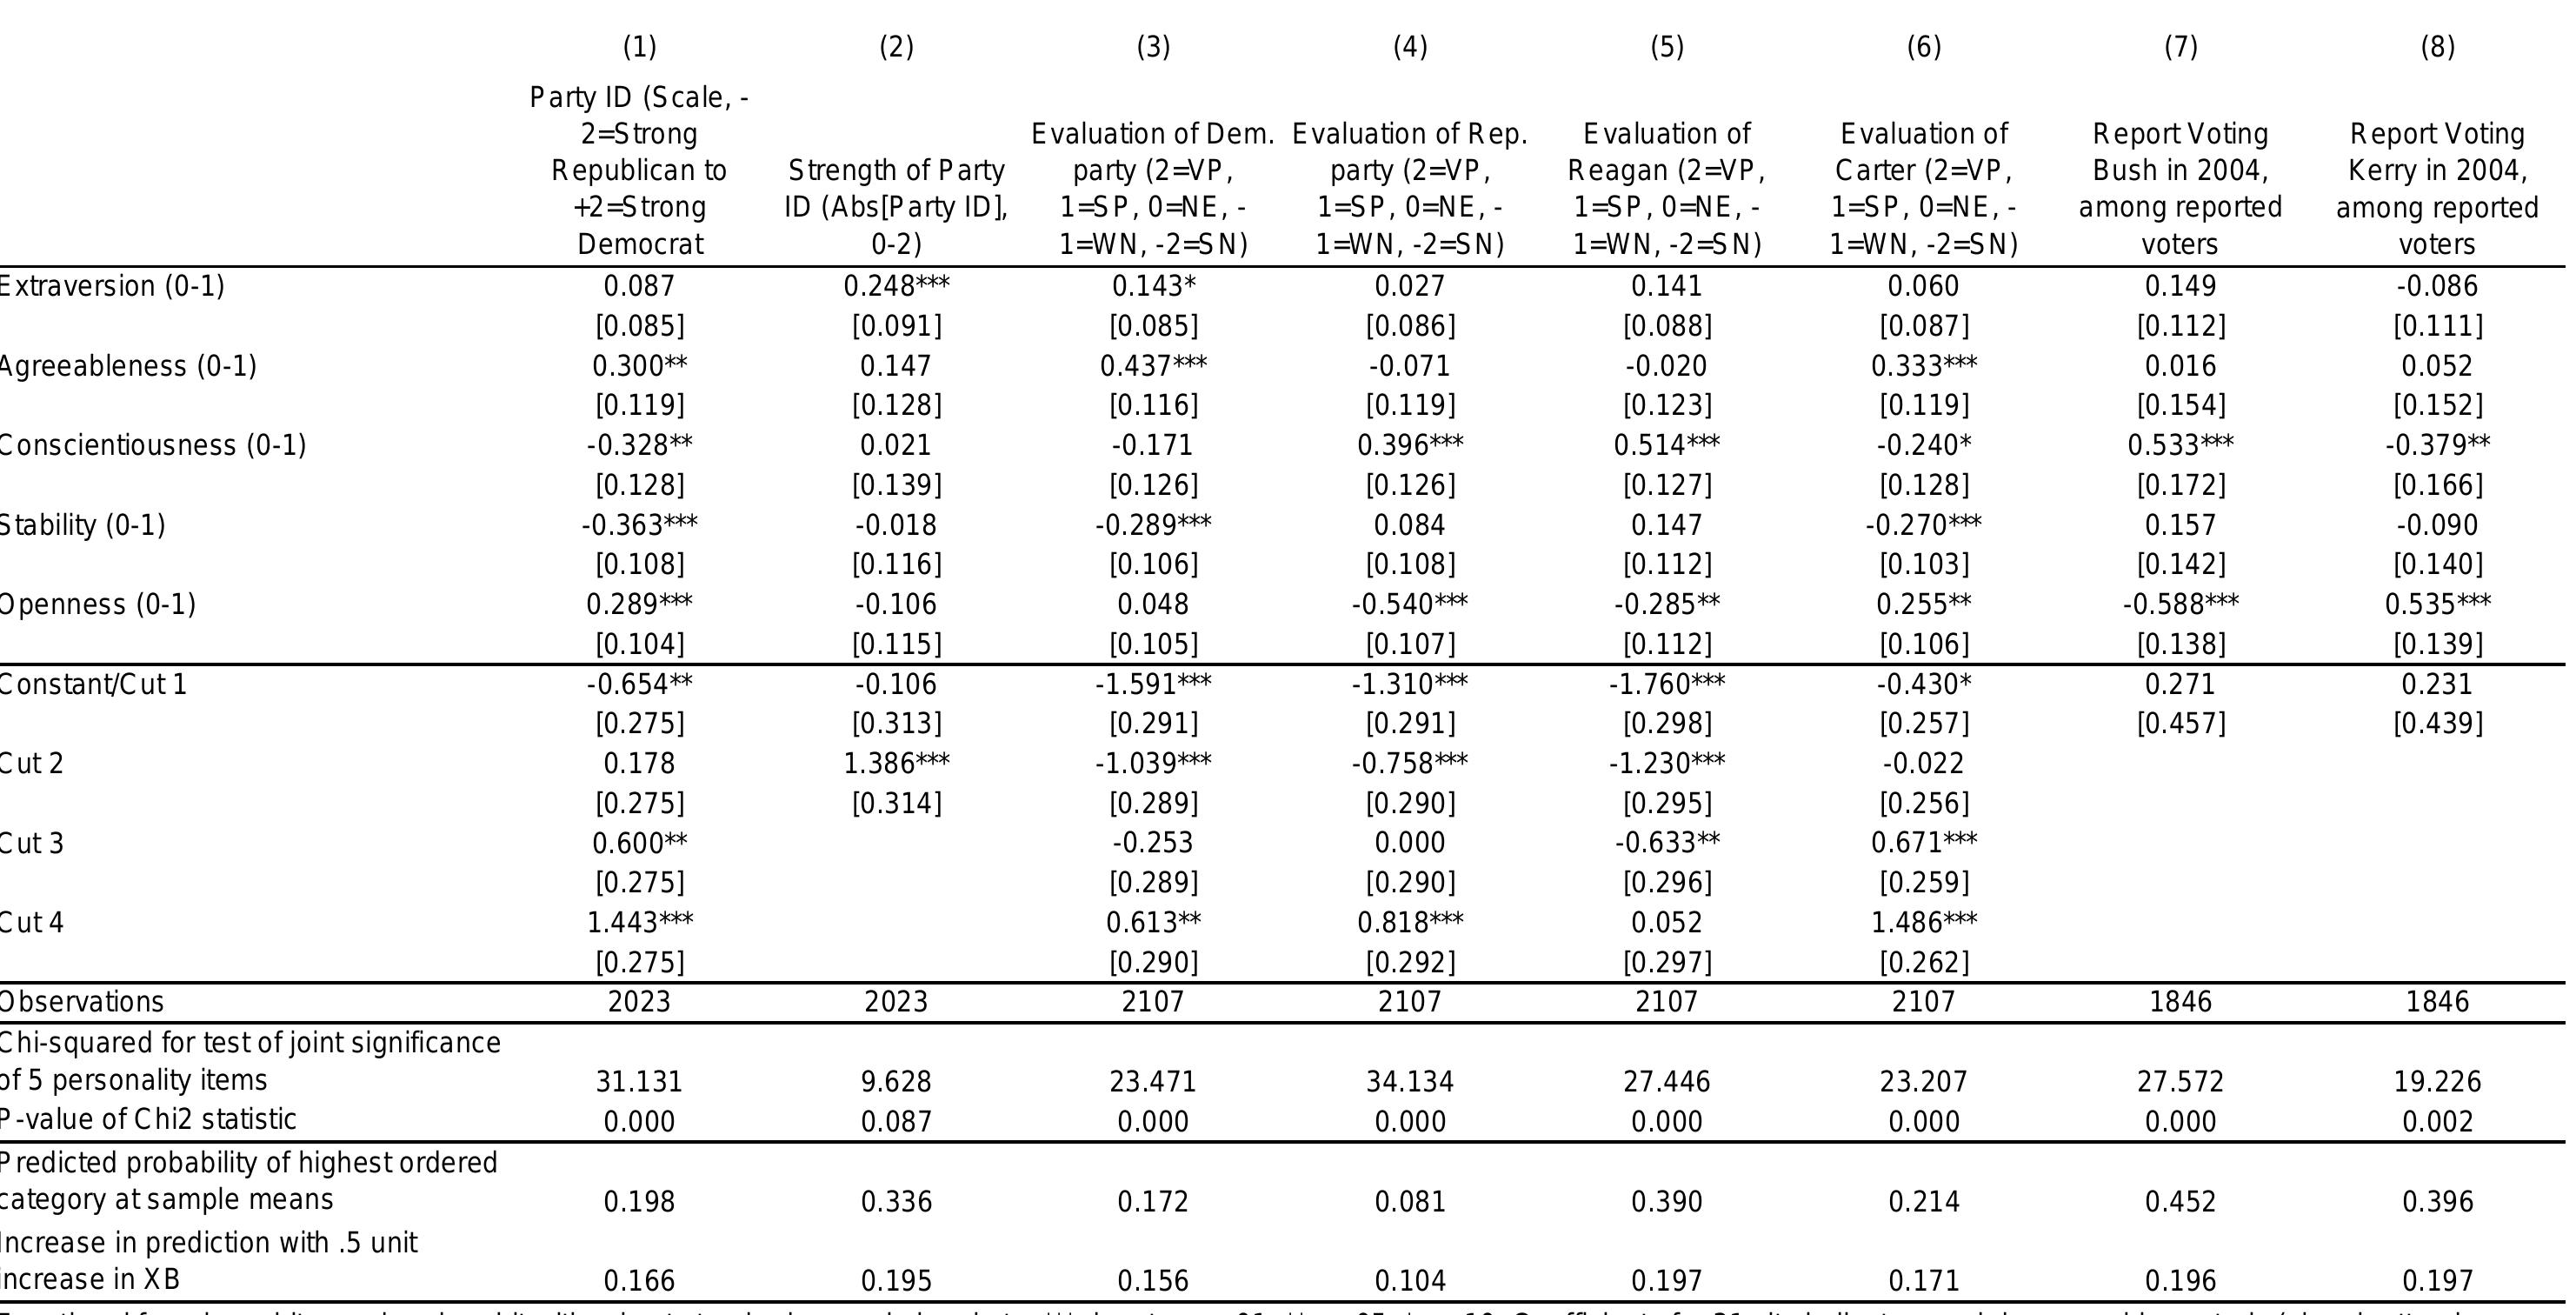
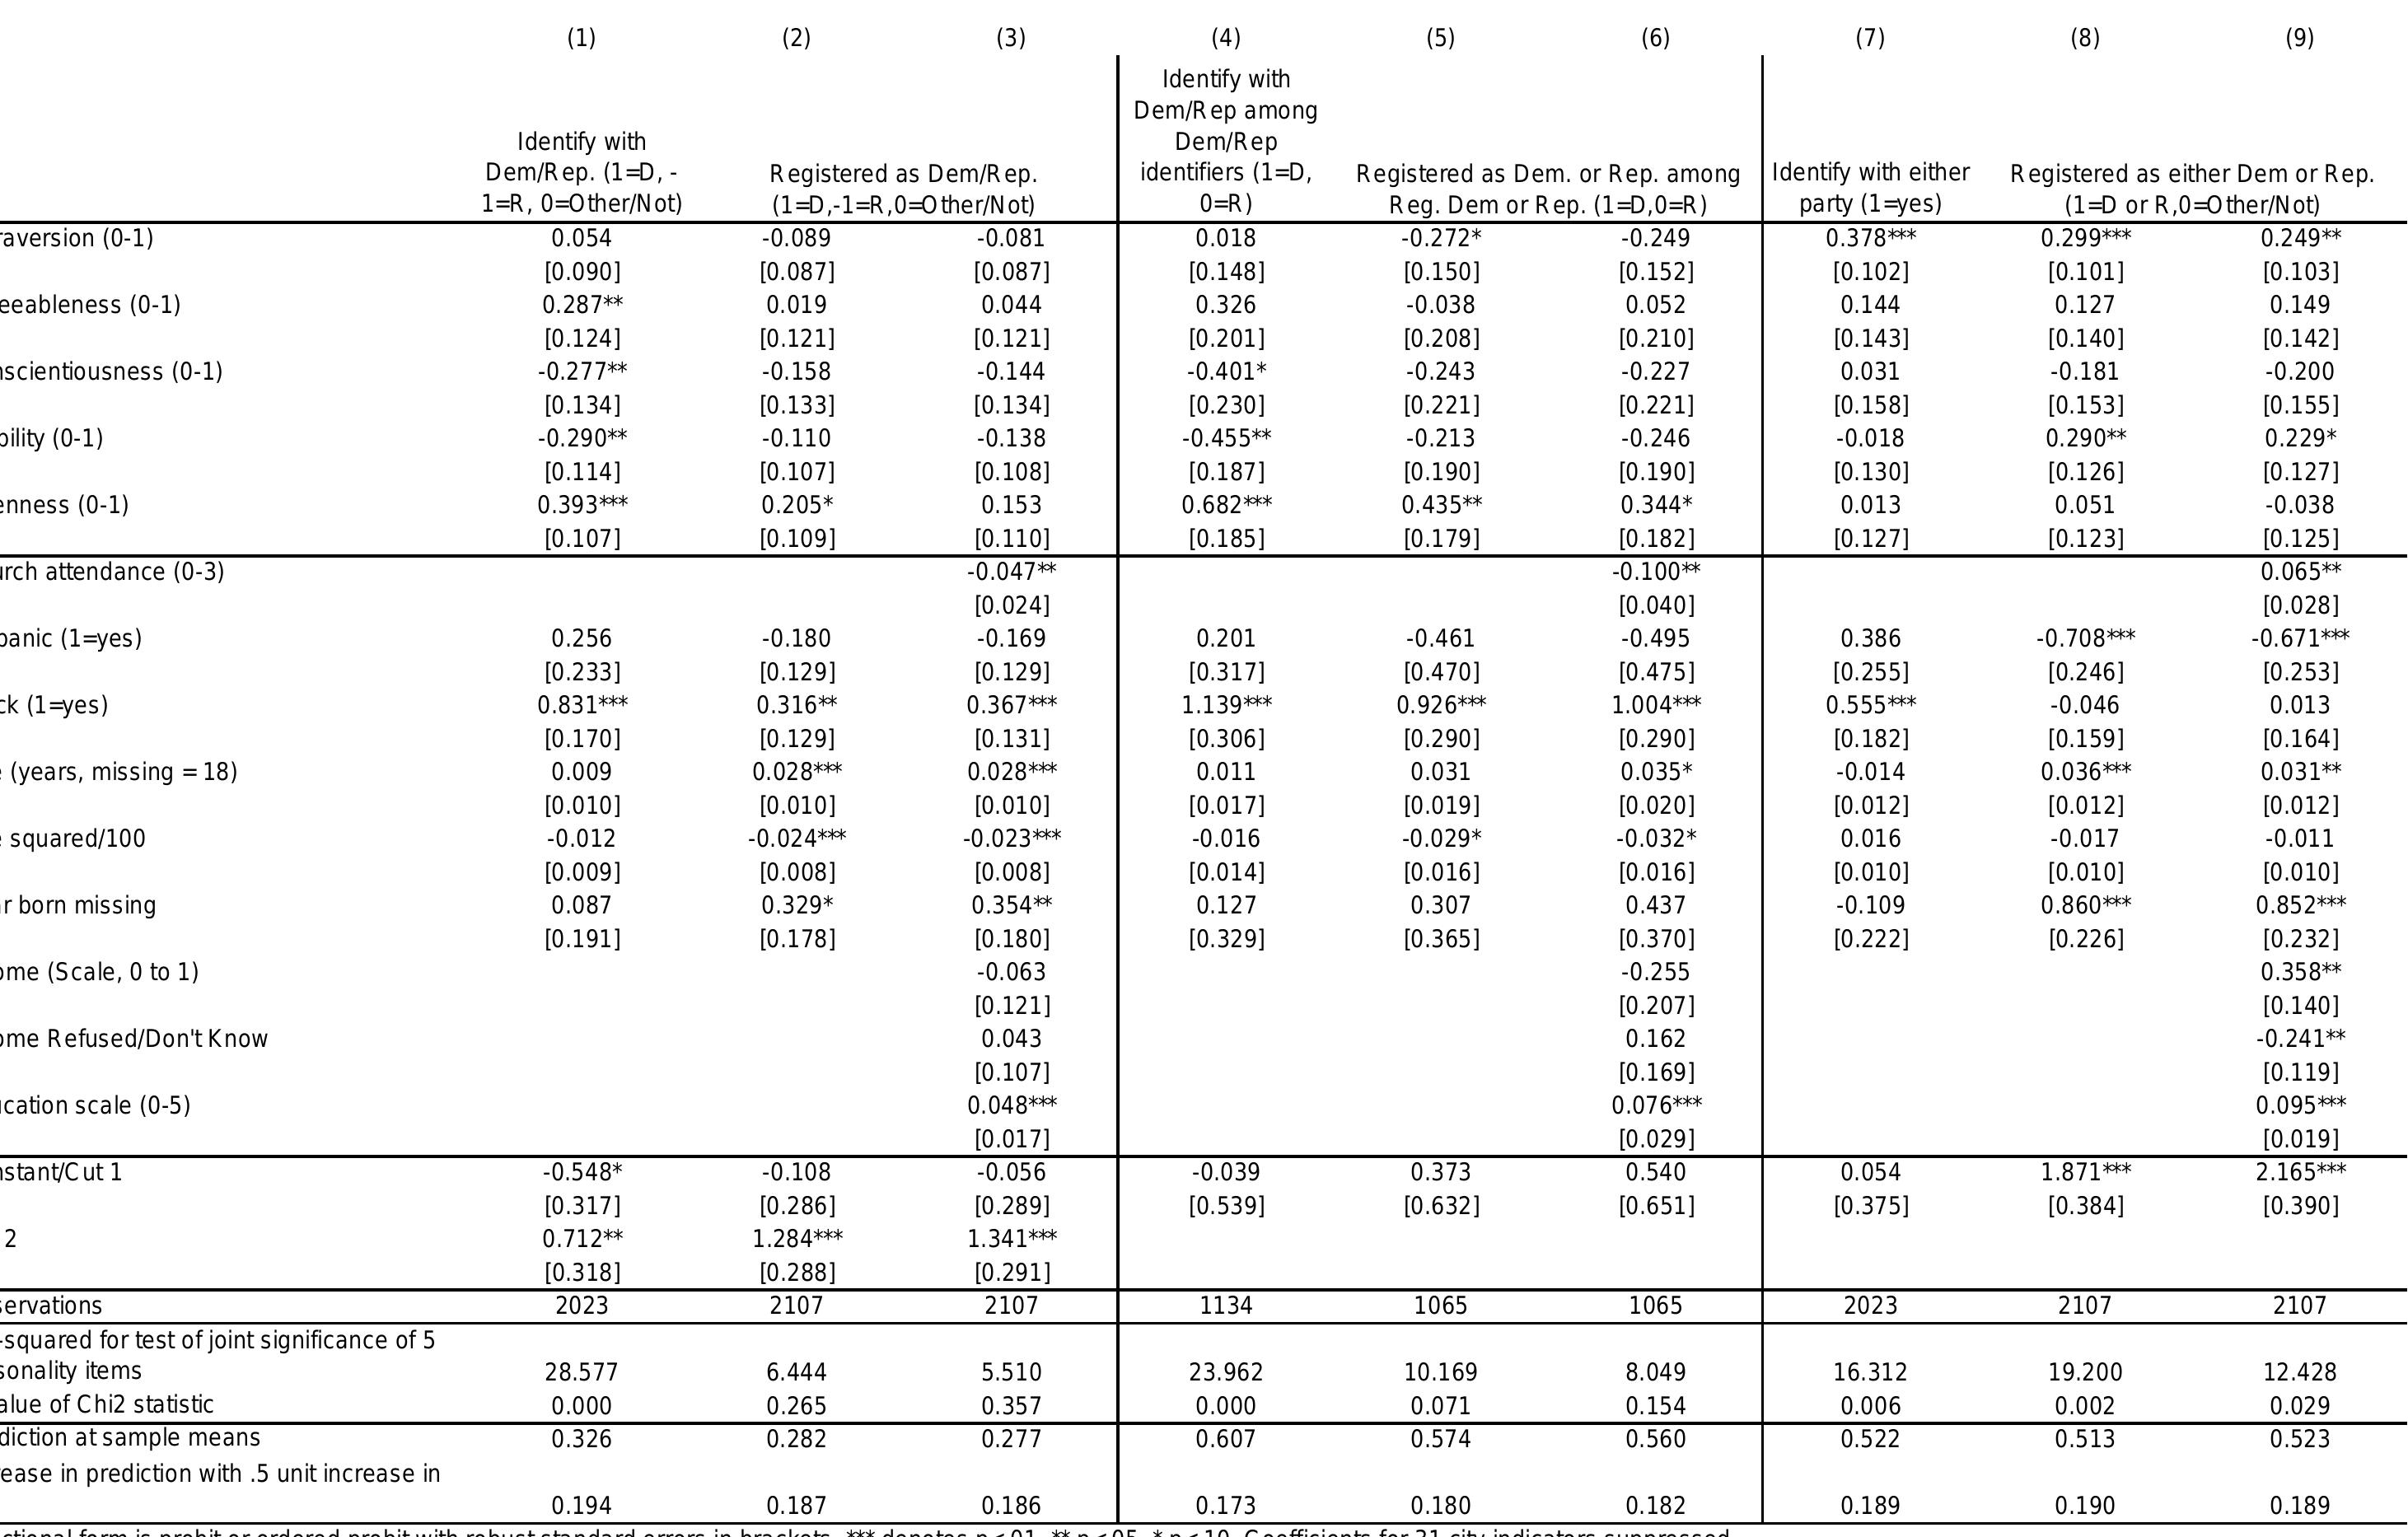
Openness is linked to Democratic affiliation, while Conscientiousness shows a tendency toward Republican registration, influencing votes significantly.
The study utilizes the Ten Item Personality Inventory (TIPI), a concise, reliable measure, across over 3,000 respondents.
Political scientists largely re-evaluated personality's influence in the 1990s, integrating findings from psychology into political studies.
If personality drives political behavior, it may challenge traditional views on political socialization's role in shaping political attitudes.
The Journal of Politics, 2011
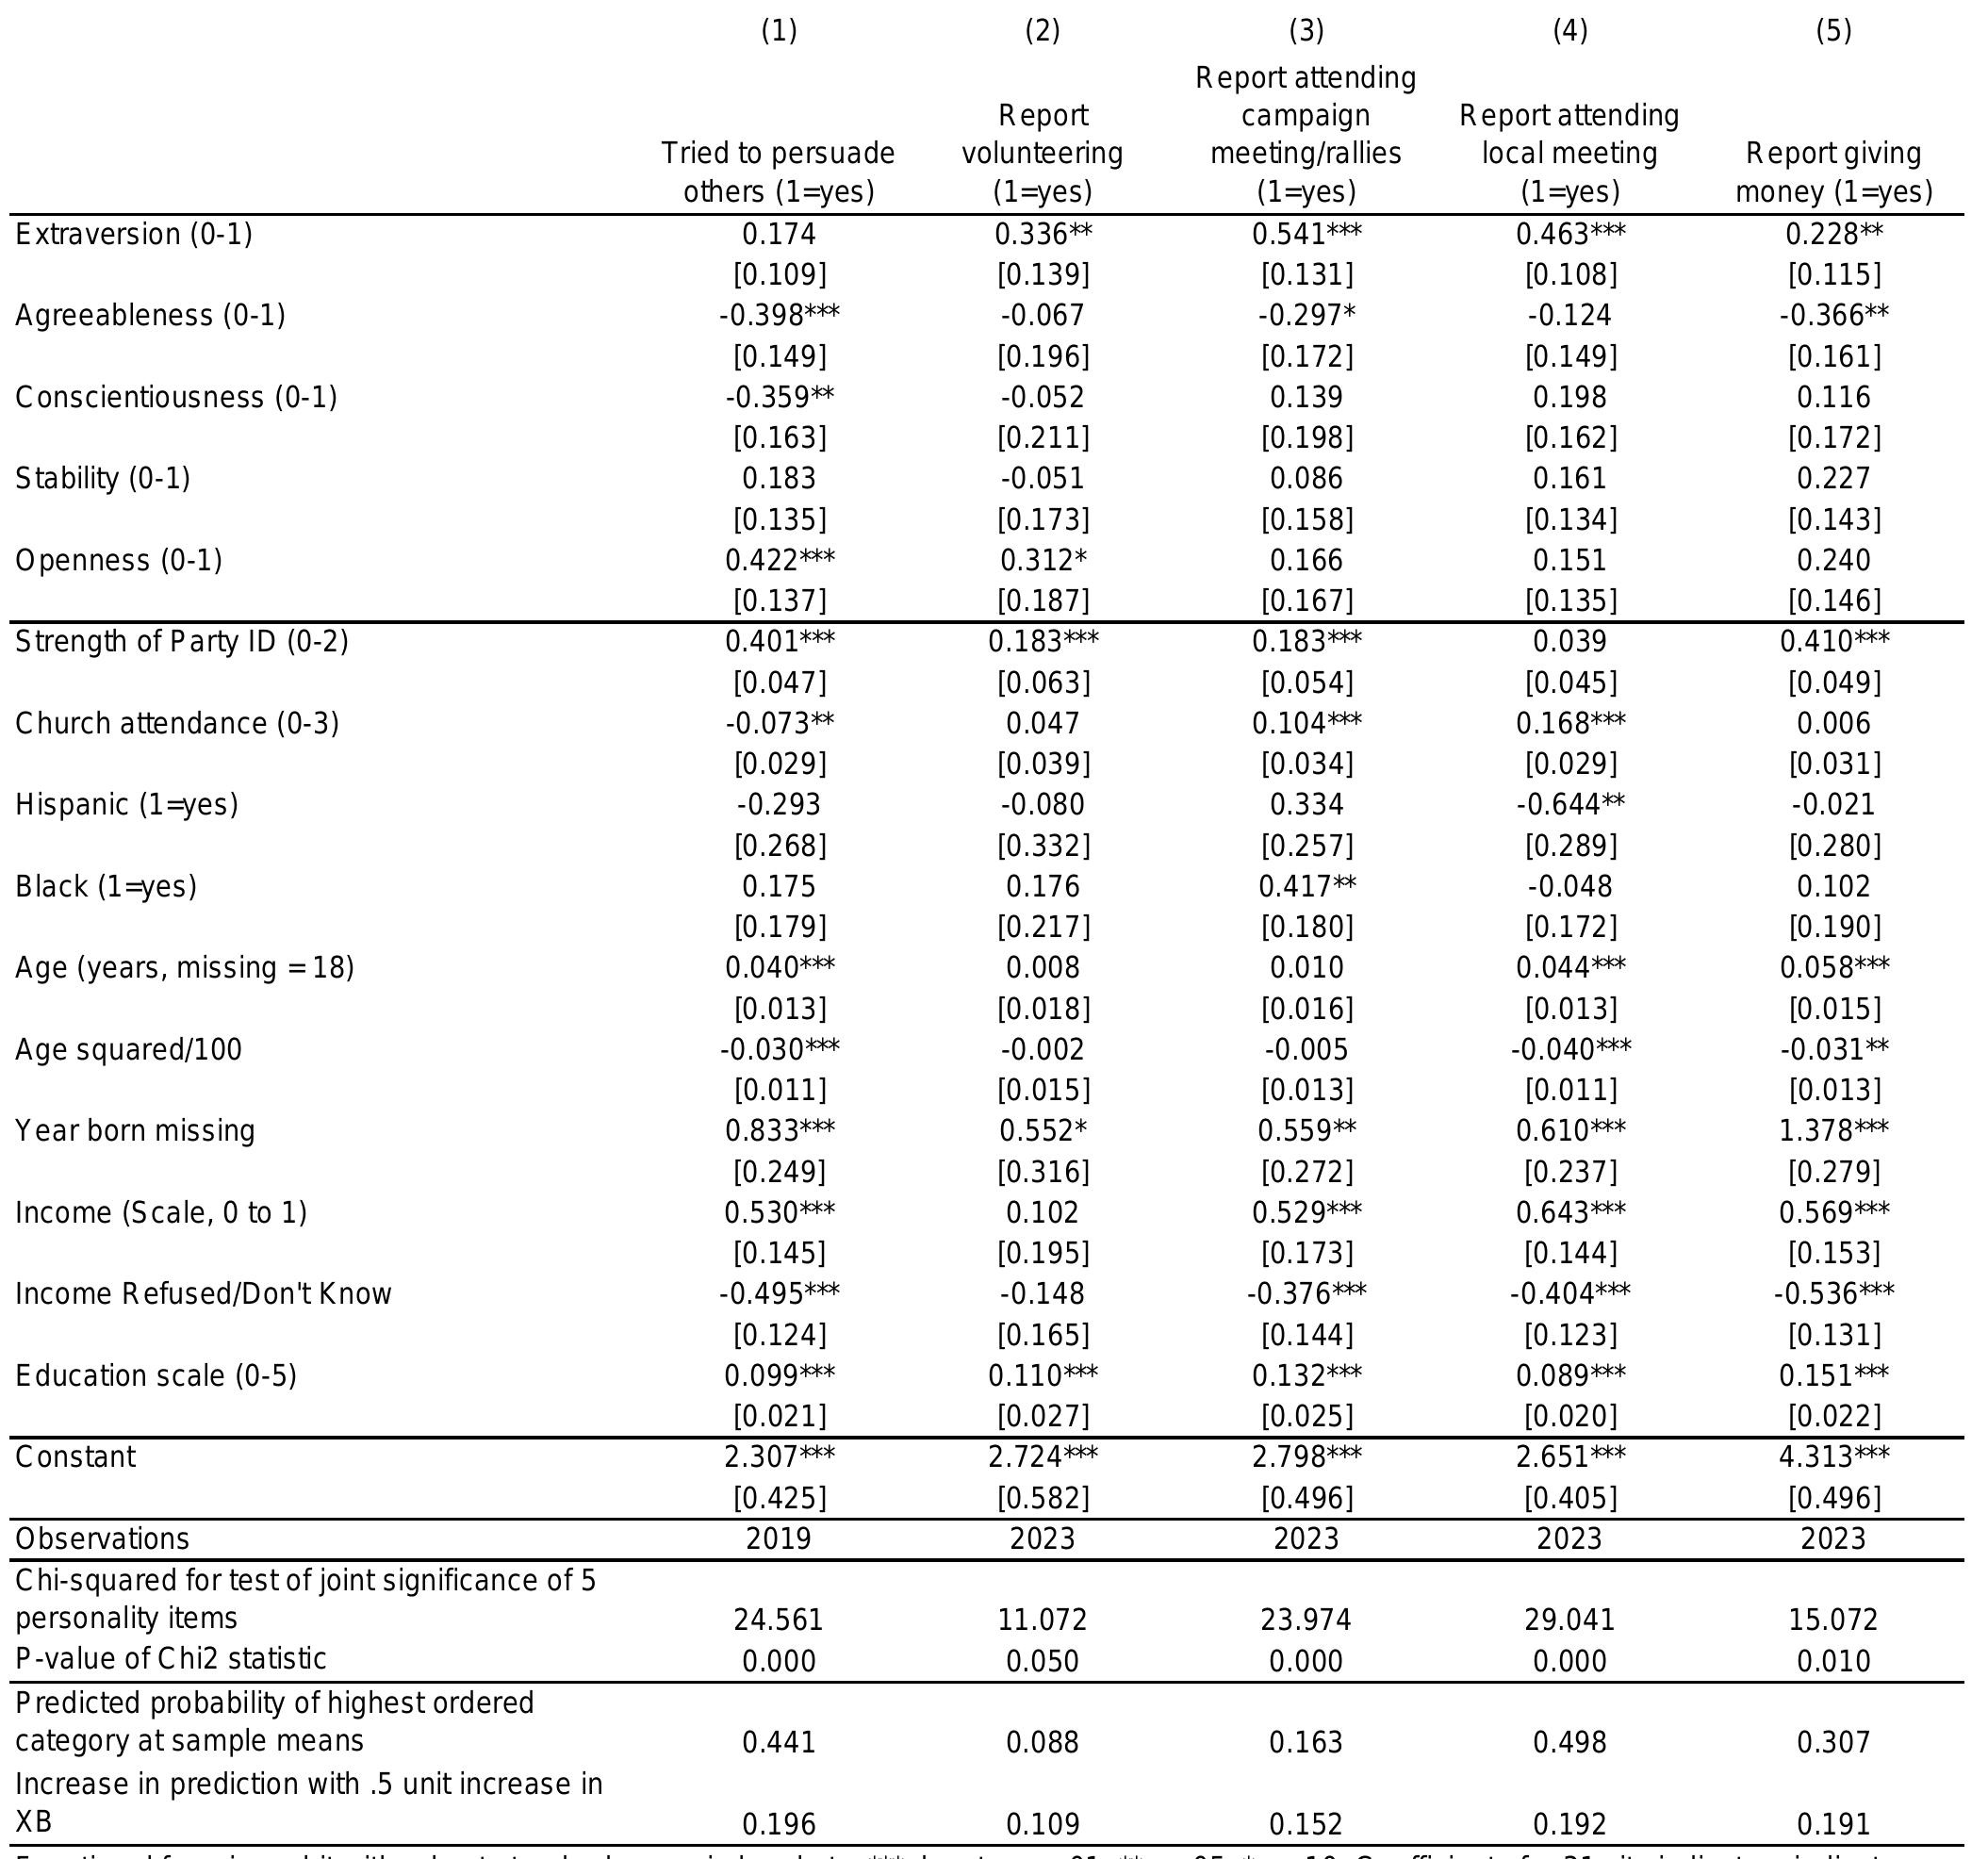
Using data from two recent surveys, we analyze the relationship between Big Five personality traits and political participation. We examine forms of participation that differ in domain (local politics vs. national campaigns) as well as in the amount of conflict involved, whether they are likely to yield instrumental benefits, and whether they are likely to be viewed as a duty-characteristics that may affect the relationships between dispositional personality traits and political activity. We find relationships between personality traits and: (1) both self-reported and actual turnout (measured using administrative records), (2) overreporting of turnout, and (3) a variety of other modes of participation. The effect of personality on political participation is often comparable to the effects of factors that are central in earlier models of turnout, such as education and income. Consistent with our theoretical expectations, these relationships vary depending on personality-relevant characteristics of each participatory act.
This article examines the link between personality traits, political attitudes and the propensity to vote in elections, using an Internet panel survey conducted in two Canadian provinces at the time of the 2008 federal election and the subsequent provincial elections. It first establishes that the two most proximate attitudes that shape one's propensity to vote are political interest and sense of civic duty. The article then look at specific personality traits (altruism, shyness, efficacy and conflict avoidance) that could affect level of political interest, civic duty and the propensity to vote in elections. In the last part of the analysis, a model is proposed and tested, according to which the impact of personality traits is indirect, being mediated by interest and duty. The article shows that the data are consistent with such an interpretation.
Electoral Studies, 2017
Why are some people more responsive to campaign mobilization than others? I argue that the composition of a person's core personality makes some people more responsive to mobilization cues than others. However, the degree to which personality alters the effectiveness of mobilization also depends on the type of political participation for which people are being mobilized. I explore the determinants of political participation by looking at the interaction between the Big-5 traits of agreeableness, conscientiousness, and emotional stability and the intensity of campaign environments. This paper demonstrates that despite the possible ameliorative effect mobilization has on unequal patterns of political participation, an enduring source of participatory inequality may very well be rooted in a person's core psychological structure.
Political Behavior, 2012
Recent analyses have demonstrated that personality affects political behavior. According to the mediation hypothesis, the effect of personality on political participation is mediated by classical predictors, such as political interest, internal efficacy, political discussion, or the sense that voting is a civic duty. This paper outlines various paths that link personality traits to two participatory activities: voter turnout in European Parliament elections and participation in protest actions. The hypotheses are tested with data from a large, nationally representative, face-to-face survey of the Spanish population conducted before and after the 2009 European Parliament elections using log-linear path models that are well suited to study indirect relationships. The results clearly confirm that the effects of personality traits on voter turnout and protest participation are sizeable but indirect. They are mediated by attitudinal predictors.
American Political Science Review, 2010
People's enduring psychological tendencies are reflected in their traits. Contemporary research on personality establishes that traits are rooted largely in biology, and that the central aspects of personality can be captured in frameworks, or taxonomies, focused on five trait dimensions: openness to experience, conscientiousness, extraversion, agreeableness, and emotional stability. In this article, we integrate a five-factor view of trait structure within a holistic model of the antecedents of political behavior, one that accounts not only for personality, but also for other factors, including biological and environmental influences. This approach permits attention to the complex processes that likely underlie trait effects, and especially to possible trait–situation interactions. Primary tests of our hypotheses draw on data from a 2006 U.S. survey, with supplemental tests introducing data from Uruguay and Venezuela. Empirical analyses not only provide evidence of the value of...
Discover Psychology, 2023
Western democracies' voting practices have altered recently, most notably with candidates now taking center stage at the expense of the institutions. These events are the result of a phenomenon called the personalisation of politics. The present review aims to synthesize evidence regarding the impact of voters' evaluation of candidates' traits on political outcomes and the effects of voters' traits on voting. Included studies were identified via electronic databases (up to July 2019). Reviewers extracted data respecting inclusion and exclusion criteria. Methodological quality was assessed independently by two reviewers. Data synthesis was executed through narrative processes. 288 studies were identified, 12 of which were selected for review. Four main outcomes were found: (i) Personality traits and voting behaviour; (ii) Implicit/ explicit trait associations and political outcomes; (iii) Party identification and personality traits; and (iv) Ideology and personality traits. Data obtained suggests that political outcomes are heavily influenced by voters' personality traits and how they perceive the personality traits of the candidates. This review advances the theory of personality trait matching and establishes a connection between traits and the personalization of politics.
Personality and Individual Differences, 2010
Building upon a series of works by Thomas J. Bouchard, Lindon J. Eaves, Hans J. Eysenck and other contemporaries, we present strong evidence that the assumed causal relationship between personality and left-right ideology is too simplistic. We suggest the relationship is not predictive and instead is better understood by dividing the overarching left-right ideological spectrum into more meaningful attitude dimensions. In doing so, we find that Psychoticism is strongly related to conservative positions on Punishment, Religious, and Sex attitudes, whereas Social Desirability is related to liberal positions on the same attitudes. Furthermore, the nature of the covariance between Psychoticism and social attitudes is due to a common genetic influence, while covariance between Social Desirability and these attitudes in females is largely a function of common shared environmental covariance.
Personality and Individual Differences, 2012
A General Factor of Personality (GFP) was extracted in two studies in order to examine its relationship with political variables. Only one of nine phenotypic associations between the GFP and variables measuring left-right political orientations was significant, which suggests that people who score highly on the GFP are not typically ''left'' or ''right'' in political orientation. However, respondents scoring highly on the GFP were somewhat more likely to take an interest in politics and tended to have higher levels of education, financial satisfaction and income. A heritability analysis conducted to determine whether the GFP and political variables share a common genetic influence produced heritability estimates of .49 (.29 to .58) and .43 (.23 to .51) for the GFP, but the lack of significant phenotypic correlations between the GFP and measures of left-right differences precluded a search for a common genetic factor.
British Journal of Political Science, 2008
This article uses longitudinal data from the National Child Development Study (NCDS) to investigate the determinants of voter turnout in the 1997 British general election. It introduces measures of cognitive ability and personality into the participation literature and finds that they are significant determinants of turnout. It also shows that standard turnout models may be biased by the inclusion of the much used ‘interest in politics’ measure. A bivariate probit model of turnout and political interest finds that individuals with high comprehension ability and an aggressive personality are more likely to both turn out to vote and have an interest in politics.
2013
A wealth of theoretical and empirical work suggests that conservative orientations in the mass public are meaningfully associated with personality dispositions related to needs to manage uncertainty and threat. Recent empirical research, however, suggests that (1) associations between these needs and economic conservatism are substantially weaker than associations with conservative identifications and social conservatism, and (2) political sophistication plays an important role in moderating the translation of needs into political preferences within the economic domain. The present paper extends this work by offering a theoretical model of the heterogeneous translation of personality dispositions into political preferences across issues and issue domains. We argue that these needs structure preferences directly for highly symbolic issues like those in the social domain, but structure preferences indirectly through partisanship for difficult issues like those in the economic domain. We test this theory utilizing a national survey experiment in the United States, and explore its broader implications for both the literature on the psychological determinants of political ideology, and for debates over the “culture war” in the United States.